Introduction
The plotting menu lets you create plots interactively. The menu can be opened by going to:
Tools > Postscript Plotting
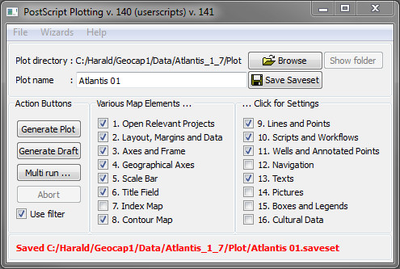
The Plotting Main Menu
In this section:
Getting started
Select working directory
Since the plot ultimately will be a Postscript file, it is necessary to select a directory on disk. This directory must have the name Plot, e.g "C:/tmp/Plot". No other directory name is accepted. In this directory both the postscript file and the saveset will be put.
Create a saveset
Enter a name for the plot, e.g. "My plot". The name can be in one or more word, avoid special characters, but - + and space are accepted. Now you may save the saveset of the plot by pressing the Save Saveset button on the right. Now a file called My plot.saveset is saved in C:/tmp/plot/ This saveset contains all setting for the plot named "My plot" and next time the dPlot main panel is activated, you'll find this saveset under File > Recent saveset files. Whenever changes are made to the settings of a plot, remember to save the saveset.
The Process
When working on a project, it is common to create a few layouts (savesets) and then produce a large number of plots in each layout. The layout is created by producing a plot. To create new plots, change the name and save the saveset. Then make the necessary changes to the new plot. A layout could be A4 Portrait used for all maps, then another layout for large regional maps, scaled 1:200000 and a third layout for thematic maps and a fourth layout for maps scaled 1:50000 zoomed into a prospect.
Initiate plot
Click Layout and Margins to open up the Initialization panel where the scale, layout and margins are set. In this panel you may also introduce a main dataset. This dataset is optional, but a grid is required if you want to display a contour map.
The Initiate plot panel
Observe that the sizes reported at the bottom change when the scaling, coordinates and margins are changed. Select a size that fits your needs and the limitations of your plotter. Your plot may either be scaled to the main dataset or to coordinates which are useful when you want to plot a subsection of the plot.
The margins should allow for the axes of the plots to be plotted in the margins. Also if the so called Gray Frame is used, the margins should be set to a little bit larger than the gray frame. The media selector has a few preset sizes a3/a4 and landscape/portrait that may be referred to as not scaled and a Scale 1: which will give a scaled plot.
Adding elements
Elements can be added to your plot, simply tick the checkbox in front of the element name. The ticked elements will be included in the plot. When an element is ticked, the settings menu belonging to that element will pop up. The settings menu will for many elements (navigation, lines/points, scripts, wells, pictures, text) allow input from file(s). To skip an element e.g. ÆLines and Points*, simply untick the checkbox.
While testing a new element on a plot it may be a good idea to untoggle time-consuming elements like Navigation and Contour Map while getting e.g. your Lines and Points right.
Draft run plot
To see how your plot looks like you can use the Draft Run button. This will produce the PostScript file a lot faster than the Run Plot button, because it uses coarser contouring. To see the plot click File > View plot in Ghostview. Every time you use the Draft Run button the PostScript file will be updated, so you only need to refresh the Ghostview application to see the changes.
Multiple plots
Plotting often involves the creation of several maps. Press the Multi Run button to display the dialog for creating multiple map files. Browse in the names of the savesets you want to run.

