Navigation lines, shot point numbers and stacking velocities
Introduction
The Navigation plug-in Geocap handles seismic navigation lines, stacking velocities and depth conversion. The plug-in is part of the Oil & Gas module.
The following describes the command syntax for the functionality collected in this plug-in.
Together with general mapping and modeling functionality in Geocap it governs a flexible platform for velocity analysis and horizon based depth conversion.
The functionality can be operated through scripts, commands or a user dedicated menu.
On this page:
Description of navigation lines, shot point numbers and stacking velocities
Navigation lines are also called stacking velocities or shot point lines and will be used interchangeably.
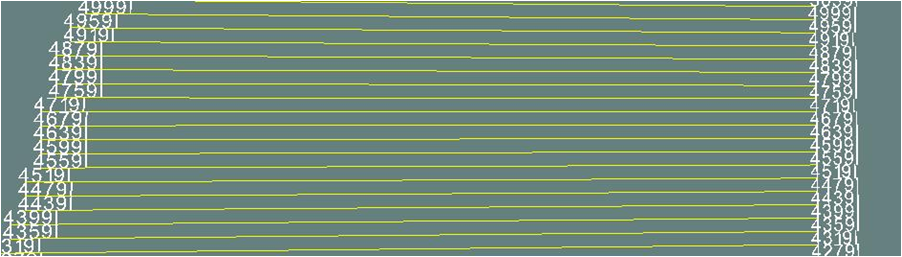
The navigation lines go in one direction. Each navigation line contains many different shot point numbers.
Shot points of same number go in the other direction. Underneath each shot point sits the stacking velocities in a gather.
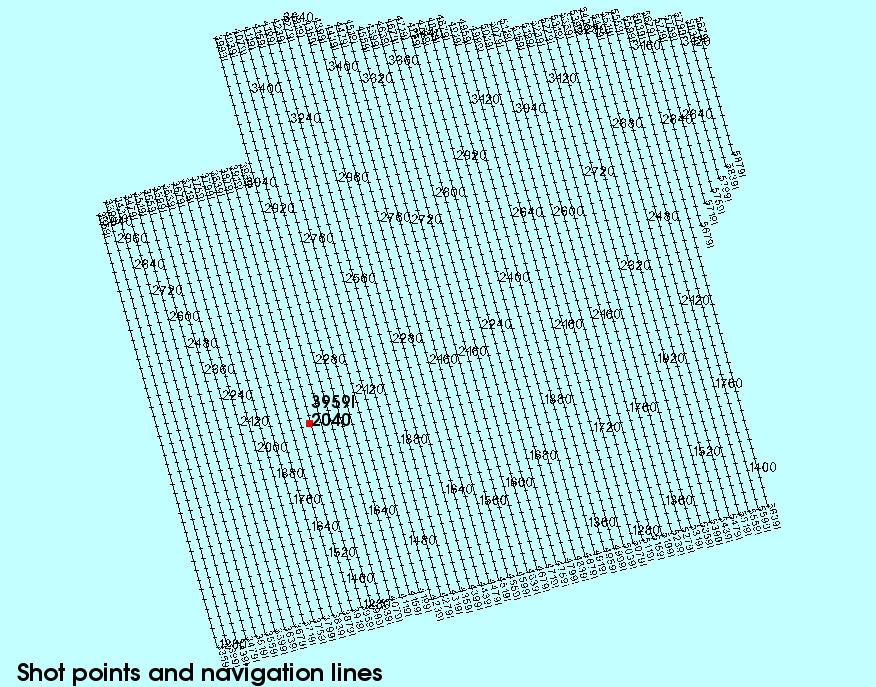
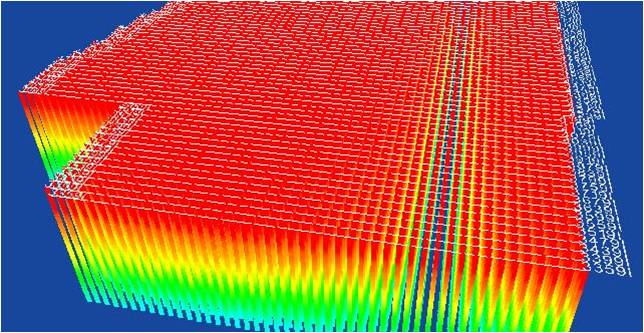
Shot points and navigation lines
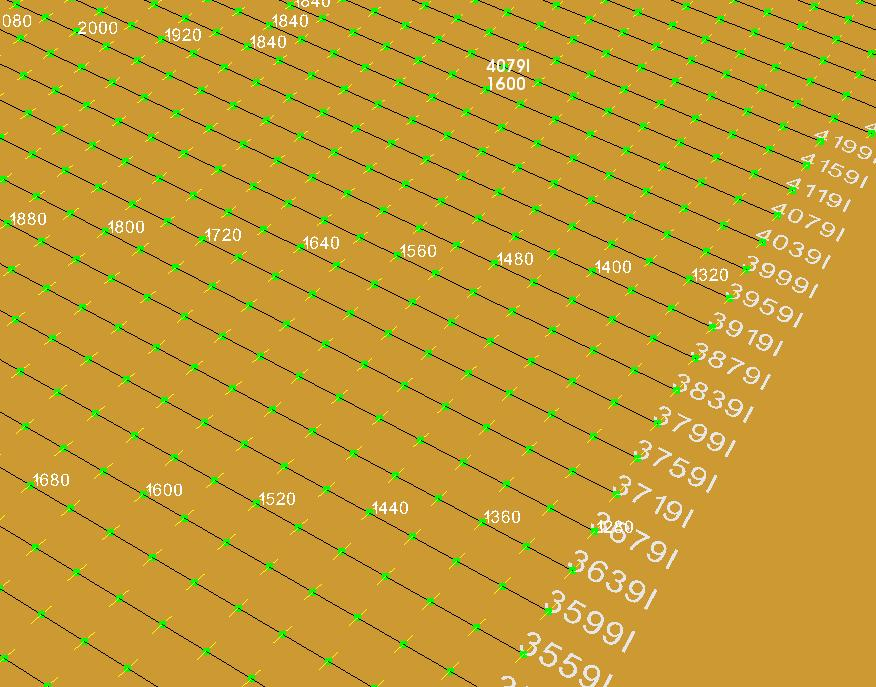
Detail of navigation lines and id and some shot point numbers
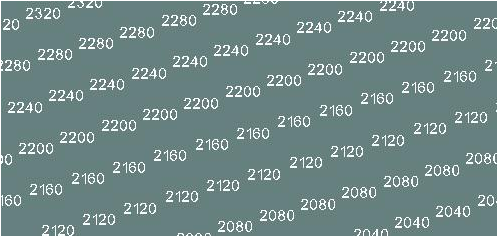
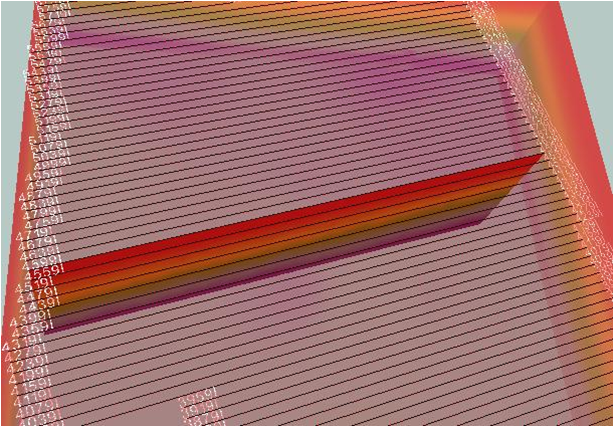
Navigation stacking velocities.
The following ASCII shot point file represents an example:
        Line name     Shot point  x coord   y coord    time   velocity
        3359I          1280     530196.6  6757992.7   548    1517
        3359I          1280     530196.6  6757992.7   608    1566
        3359I          1280     530196.6  6757992.7   664    1585
        .  .  .  .  .  .  .  .  .
        .  .  .  .  .  .  .  .  .
        3359I          1280     530196.6  6757992.7  3774    3318
        3359I          1280     530196.6  6757992.7  4014    3464
        3359I          1280     530196.6  6757992.7  4986    3961
        3359I          1320     530064.0  6758475.0     0    1470
        3359I          1320     530064.0  6758475.0   475    1470
        3359I          1320     530064.0  6758475.0   562    1533
        3359I          1320     530064.0  6758475.0   615    1573
        .  .  .  .  .  .  .  .  .
        .  .  .  .  .  .  .  .  .
        3439I          1280     531160.9  6758258.8     0    1470
        3439I          1280     531160.9  6758258.8   472    1470
        3439I          1280     531160.9  6758258.8   519    1476
        3439I          1280     531160.9  6758258.8   587    1525
        .  .  .  .  .  .  .  .  .
        .  .  .  .  .  .  .  .  .
This special format is called a navigation velocity stacking format in Geocap and the whole file is converted to a Geocap vtk file and placed in the project.
This file is read into a project folder by Import->Stacking Velocities. Shot point are in field data SP and Line Name are in field data 2Dline.
Check the import afterwards in Table View to see that the field data columns are properly assigned.
The navigation file is converted to a cell structure making a new cell whenever the shot point number changes.
The command syntax for manipulation this dataset is placed under the command nav for navigation, because this kind of file traditionally belongs to a navigation file.
All functionality connected to the nav command is placed in the plug-in called Navigation. This plug-in is included in the Oil & Gas module and must be loaded into Geocap in order to operate the functionality.
Syntax description of the nav command.
Making new datasets from the navigation stacking file
The following commands require that the stacking velocity dataset is the active data.
nav mak cells ;# make cells of stacking velocity. Each vertical stacking column is a cell. Should be performed if the stacking velocity file has no cell structure; i.e. contains only one cell.
nav mak shotpoints ;# make one line set of all the first top shot points.
nav mak timevel selshot cur | _shotpoint_number ;# select time and velocity data for shot point closest to the cursor position (cur) or for a certain shot point number shotpoint_number. Produces also an additional dataset navcross in workspace which can be triangulated by nav gen trg.
nav mak timevel cur ;# make time and velocity column at the cursor position.
Making navigation stacking file from SEGY dataset.
The situation is that stacking velocities are present as a SEGY file which is read into a seismic folder as usual. The task is to convert the stacking velocities in the seismic format to the standard stacking velocity format.
The following command require that the outline is in workspace outline and the amplitude grid in the SEGY file is in active.
nav lin [resolution_in_xresolution_in_z] [xstart x zstart z] [name SEGY_file_name ]
resolution_in_x
The sample resolution in x direction is resolution_in_x value. Similar for depth or z direction.
xstart x
Specifies where to start the sampling in x direction. Similar in z direction.
name SEGY_file_name
Specifies the name in the field data 2Dline. This should normally be the name of the SEGY dataset.
Example of converting SEGY stacking velocity format to standard navigation stacking velocity format
nav lin ;# makes vertical lines for all nodes (grid in active, outline in outline)
nav lin 1 4 ;# makes vertical lines of sample 1 in length direction (x) and 4 in depth (z).
# The result is placed in workspace seislines.
Displaying data directly from the navigation stacking file.
The following commands require that the stacking velocity dataset is the active data.
nav dis shotpoint | shotline | shotlinepoint cur [ref:arguments];# display shot line and/or point values together at cursor position.
arguments:
col color_name – specify color.
sel selection – select every selection.
size size_value – size of numbers.
Generating a dataset by cutting at z-level in the navigation stacking file.
The following commands require that the stacking velocity dataset is the active data.
nav cut z_level [nofd] [ver] [ext] ;# cut the navigation file at a certain level
The navigation file will be cutted a level z_level. The new created dataset will be present in active after operation.
Default is that present field data SP and 2Dline are generated in the new dataset and line structure is kept.
arguments:
z_level - value of cut level. Must be present directly after nav cut.
nofd – no field data is generated, but line structure is kept if field data SP and 2Dline are present in the navigation file.
ver – interpolation is done only if the line to be cut is completely vertical. This will prevent cutting nonvertical lines if the cell structure is incorrect. A correct cell structure has one vertical line per cell.
ext – extrapolation is performed when necessary at start and stop of the line if the cut level is outside the line. In that case a curve called extrapolationcurve shall be present in workspace. The extrapolation curve has entry on X and output on Y coordinates.
Generation of triangle dataset from the selected line velocity stack.
The following command require that the selected velocity stack along a line is active data.
nav gen trg ;# generate triangle model from selected velocity stack data along a line.
An alternative is to run a prestep that makes an equal number of points for adjacent shot point gathers. This option is safer because it may work with a high resolution in all cases.
mak bandsca fix ;# run prestep and generate triangle model from selected velocity stack data along a line.
After this command one gets a solid vertical section that can be mapped and contoured.
Generation of velocity cube from the navigation stacking file.
The stacking velocities are active data.
nav gen cube stack | cel nx ny nz ;# generate 3d cube model nx ny nz from stacking velocities using time slice method and gridding.
stack – use original stacking velocities.
cel – use stacking velocities transferred to cells.
Setting an id that can subsequently be used by other nav commands.
nav set hicoreid – sets an id that can be used in other nav commands.
It can work like this:
set job <something>
nav set hicoreid $job
and then, later on
nav cal dix stack will need the following data sets to be present in workspace:
- topTimeVelocity$job
- bottonTimeVelocity$job
- topTimeSurface$job
- bottonTimeSurface$job
This is a common feature in all nav commands which use hicore (workspace).
Preset hicore names that can be adjusted by a hicoreid
topTimeSurface
topTimeVelocity
topTimeVelocityStack
bottomTimeSurface
bottomTimeVelocity
bottomTimeVelocityStack
stackingVelocityData
stackingVelocityCube
intervalVelocityDix
intervalVelocityStackDix
highSurface
Adjusting the velocity cube to check shot wells.
The velocity cube is active data.
nav acu wells_in_workspace ;# adjust cube towards check shot wells in wells_in_workspace. The format of the check shot well is: x y depth time. The scalar part is in fact time_in_milliseconds.
Performing depth conversion of time grid using velocity cube.
The active data is a time grid in milliseconds to be depth converted. The general formula for depth conversion is Depth = Time x Velocity . The time grid is probed with values from the velocity cube to get the velocity at the time grid positions.
nav depcon velocity_cube ;# perform depth conversion of time grid using velocity_cube in workspace. The result depth grid will be the new active data and is also saved as workspace depthgrid.
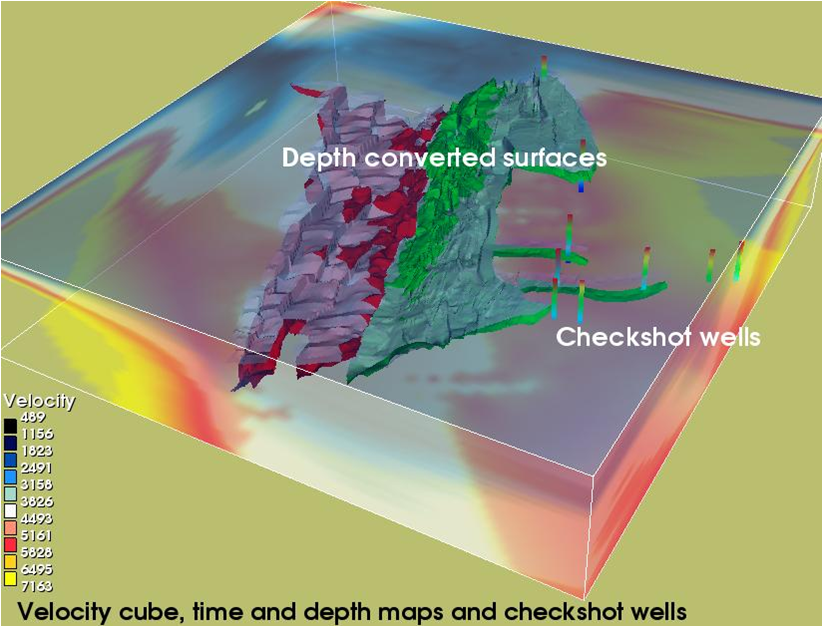
Velocity cube used to depth convert time grid to depth grid
Generation of interval velocity cube from stacking velocity cube.
The stacking velocities are active data.
nav gen cube stack | cel nx ny nz ;# generate 3d cube model nx ny nz from stacking velocities using time slice method and gridding.
stack – use original stacking velocities.
cel – use stacking velocities transferred to cells.
Calculation of velocity data, Dix formula.
The time surface is active data.
nav cal velocity stack ;# calculating velocity data for time surface in workspace. The navigation stacking file is in workspace: stackingVelocity
nav cal dix stack ;# calculate interval velocity after Dix formula.
The following datasets must be present in workspace under exact these names:
topTimeVelocity – polydata derived by nav cal velocity stack.
bottomTimeVelocity - polydata derived by nav cal velocity stack.
topTimeSurface – top time surface grid.
bottomTimeSurface – bottom time surface grid.
Calculating from stacking velocity in workspace.
The stacking velocities are active data.
nav cal int cel value ;# calculate interpolated velocity at value
nav cal int surface ;# calculate interpolated velocity for surface in workspace highSurface
nav cal ave [mid | bot] ;# calculate average depth velocities.
Default will use interval value above calculation point. mid: use middle interval. bot: use interval below. The result is saved in depthAverageValues[Top | Mid | Bot] .
Selecting data from navigation stacking file.
The stacking velocities are active data.
nav select cel select [ref:start start_number*] ;# select every select vertical stacking cell and optionally start at _start_number.
Storing Dix interval velocity data into column file format.
nav sto dix filename [ref:topbottomvelocity] ;# store interval velocity data after having it calculated so that everything is in proper place in workspace. 6 columns are written out by default. If topbottomvelocity is specified, two extra columns (7 and 8) are written out.
Standard column output:
          Shotline  Shotpoint   x           y         time     int.Velocity
          3359I     2360    526618.38   6771010.5   2319.050   2389.451
          3359I     2284    526751.00   6770528.5   2284.787   2363.030
          3359I     2279    526883.50   6770046.0   2279.813   2399.876
          .  .  .  .  .  .  .  .  .
          .  .  .  .  .  .  .  .  .
Setting nav parameters.
The stacking velocities are active data.
nav set diagonalnumber diagonalnumber ;# set number for division of diagonals. To be used for very dense stacking velocity datasets. Default number is 700. This may be increased and represents a temporary grid resolution when calculating Dix interval velocity.
nav set hicoreid hicoreid ;# all fixed workspace names can have an additional id tag attached to the name making it possible for several projects with different datasets to operate simultaneously.
Some examples of the nav command.
These scripted examples can be used as command objects with the project manager or as script commands activated in the shell.
Display all shot points numbers
Stacking velocity dataset is the active data.
nav dis shotpoints sel 1 size .7 ; # display shot points
Detail of shot point numbers
Display navigation lines
Stacking velocity dataset is the active data.
          nav dis shotlines size 1  ; # display shot line numbers
          col bla  ; # black color
          poll ; # draw cell lines
Detail of shotlines and id numbers
Select time and velocity for navigation line at cursor position
Stacking velocity dataset is the active data.
          nav mak timevel selline cur  ; # make time and velocity section at cursor position
          mhi timevel ; # save data
          mlo navcross ; # get saved navcross data
          nav gen trg ; # generate triangulate model
          map ; # map time and velocity
The velocity cube itself is displayed with an opacity: dis opa .4
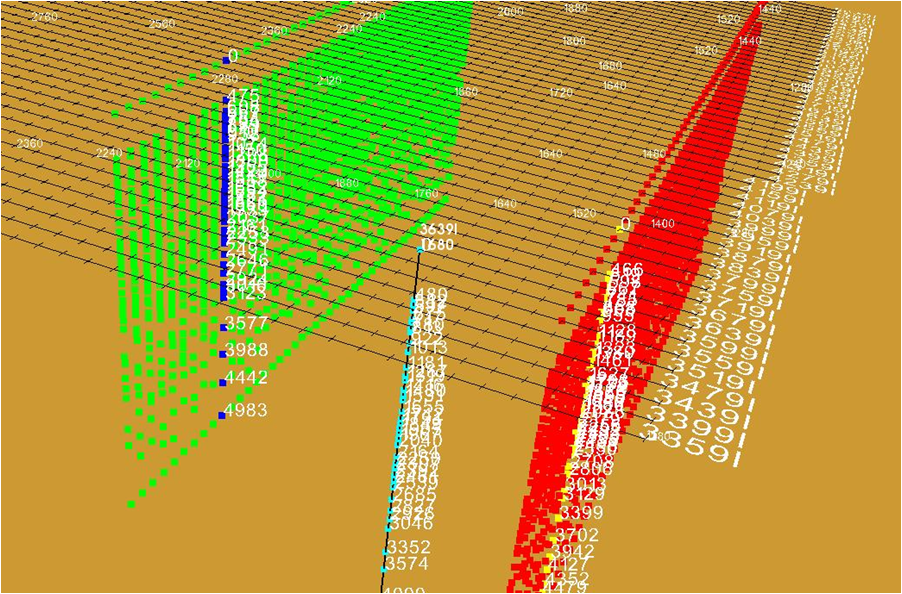
Selected stacking velocities along a line and triangulated into a vertical section
Combining several commands to a composite display
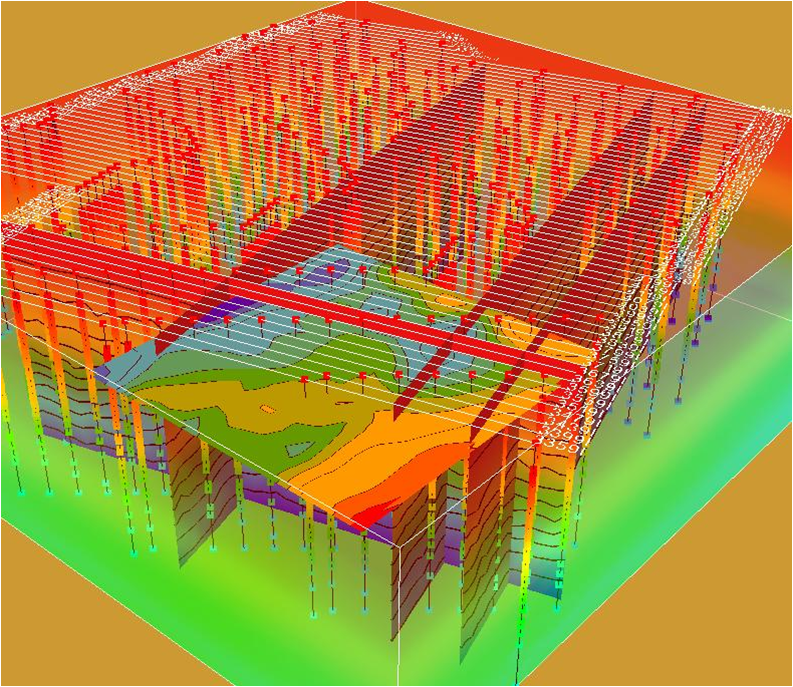
Composite display of navigation lines, stacking velocity sections and time grids
Showing selected stacking velocity data
Detail of navigation lines and stacking velocities
Showing navigation lines and stacking velocity
Stacking velocities mapped and navigation lines
Example of menus for display of navigation stacking velocities.
These menus are using scripted syntax described in this reference. They can be activated directly on a stacking velocity dataset in the project.
Mapping stacking velocities
Stacking velocity dataset is the active data.
nav dis shotpoints sel 1 size .7 ; # display shot points
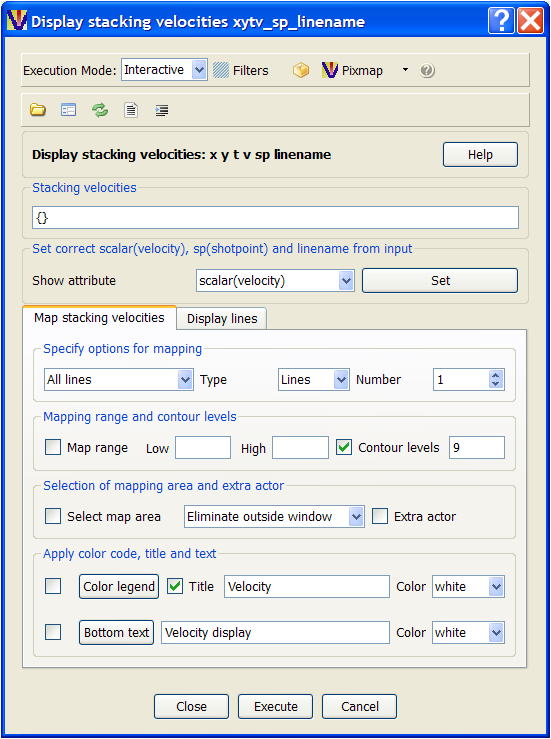
Menu for mapping stacking velocities
Displaying shot lines and shot points
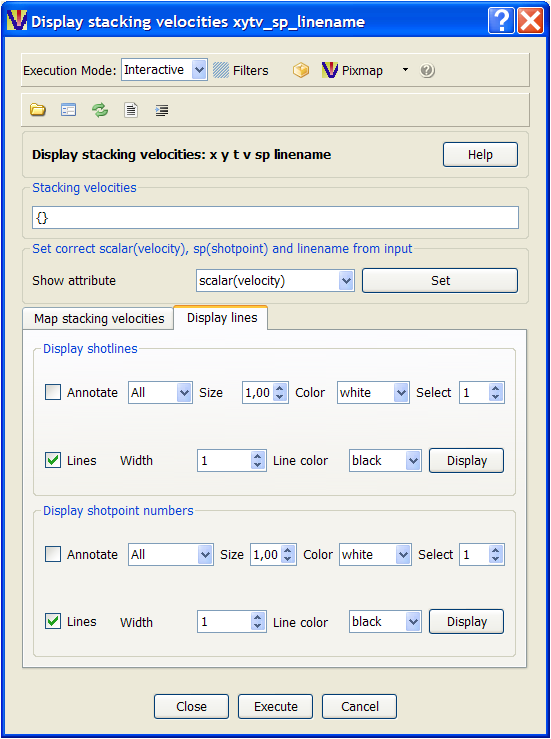
Menu for displaying shot lines and shot points