...
- In the Geocap viewer interface. Click the + icon on the toolbar and click Add Data from Map:
- All to add all layers from the map to the Geocap viewer table of contents (TOC), or
- Rasters to add all rasters from the map to the Geocap viewer table of contents (TOC)
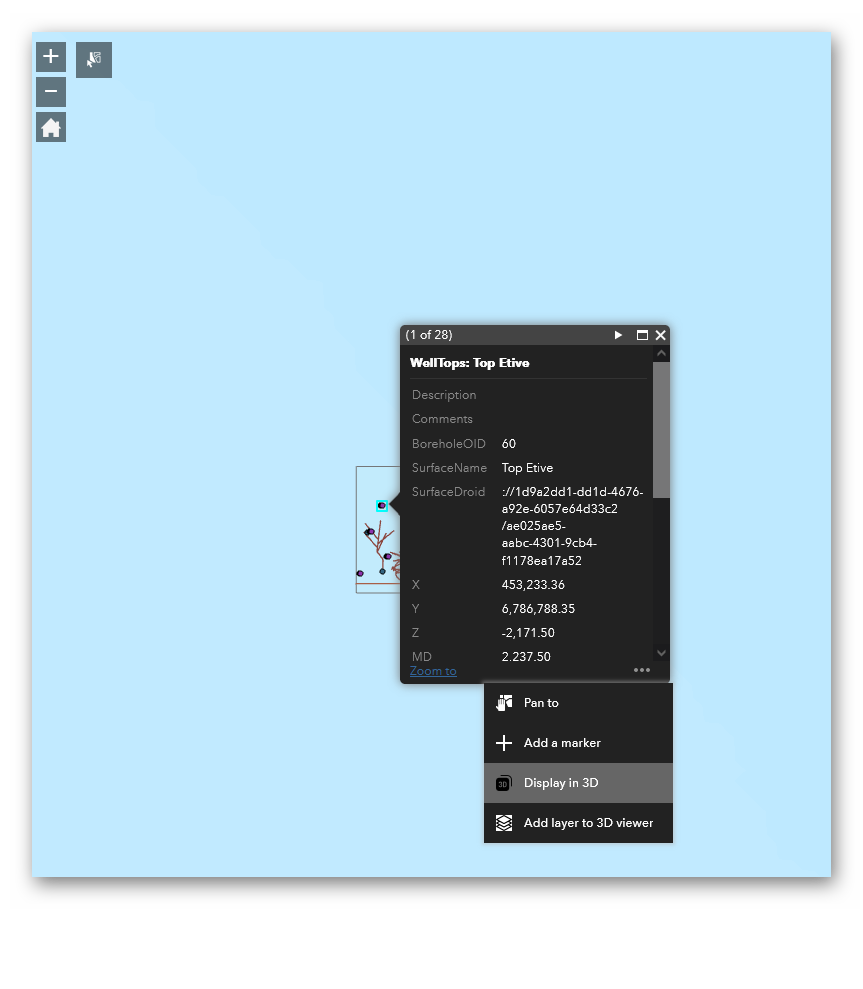
- From the map. Select a feature on the map and click the ... icon on the bottom of the pop-up window and choose:
- Display in 3D. It will add a single clicked feature to the Geocap viewer table of contents (TOC), or
- Add layer to 3D viewer. It will add an entire layer that includes the selected feature.
...
The Geocap viewer lets you store scenes for later retrieval. The scenes are stored as JSON files and can be loaded from the local filesystem or configured in the widget. Retrieving a scene will reload the graphics and the table of contents (TOC).
To save a scene:
- Load and visualize the data that you wish to save
- Click the Save Bookmark icon on the toolbar to save the current view. You may save any number of views. To restore a particular view just click on one of the thumbnails (View Bookmarks icon).
- To save the whole scene to a file click the Download Scene icon on the toolbar. The scene will be saved to a JSON file on your PC (default download location of your web browser).
...
- Publish the data to the server and add the URL for the seismic layer as described in the section on adding data.
- Ensure that both the layer item and child feature items are checked in the table of contents (TOC).
- To view seismic in 3D click the 3D button in the toolbar to ensure that the 3D view is visible.
- To view seismic in a 2D cross-section click the "..." pulldown menu in the table of contents (TOC) for the seismic item and click View in 2D. Make sure the 2D window is opened, if not then click the 2D button in the toolbar.
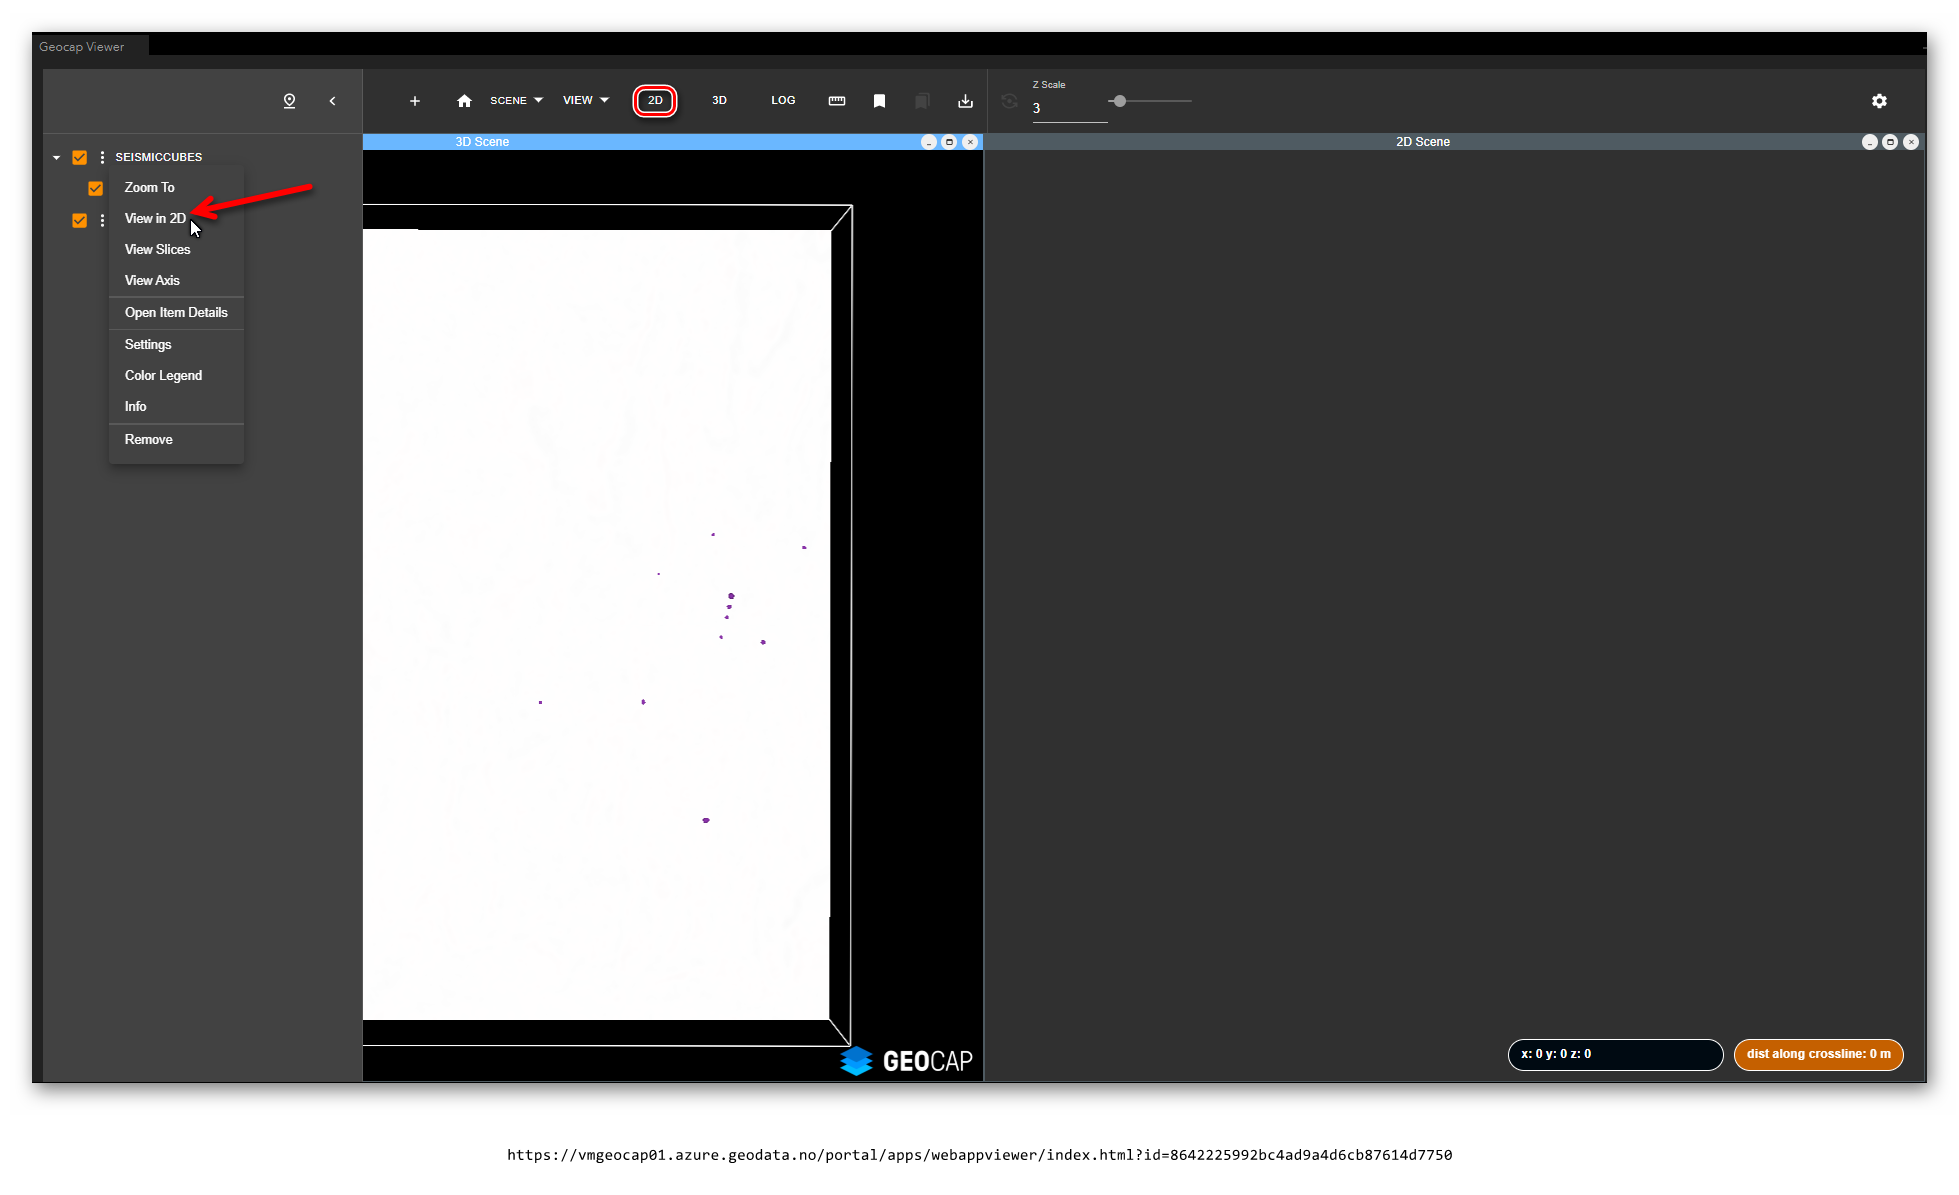
- If necessary click the "..." button for the seismic item and click zoom to. The seismic should appear.
- When using 3D seismic you can move the section by moving the section sliders. The section sliders will appear if you:
- Click on the text for the seismic item in the table of contents (TOC)
- -or
- Click the "..." pulldown menu for the item and click View Slices.
...
For non-seismic data Geocap generally does not know the z domain (time or depth) or vertical units for a dataset. Geocap performs the vertical measurement based on the z values as-is. When performing measurements on a single dataset or a group of datasets with the same vertical unit this is typically not an issue. However, if a single measurement is performed across several datasets with mixed vertical units the reported value will generally be incorrect. The user is advised to be mindful of this when performing depth measurements.
Seismic Settings panel
Loaded in the table of contents (TOC) seismic data provides a bunch of settings options available in the '...' pulldown menu of a single seismic item.
- The DATA tab provides seismic values adjustments
- The DISPLAY tab provides:
- Displaying transparency adjustment
- Data filtering
Raster Settings panel
Loaded in the table of contents (TOC) raster data provides a bunch of settings options available in the '...' pulldown menu of a single raster item.
- The DATA tab provides:
- Trimming of visible date in 3D view by viewport/3D window borders
- Adjusting elevation method
- Applying an elevation raster
- Adjusting displaying of the data by providing limit lines on the histogram
- The DISPLAY tab provides:
- Displaying transparency adjustment
- Data filtering
- Coloring method: shading single color or gradient
Feature Settings panel
Loaded in the table of contents (TOC) raster data provides a bunch of settings options available in the '...' pulldown menu of a single raster item.
- The DISPLAY tab provides:
- Displaying labels
- Adjusting symbology colors by picking one of the provided color schema available in the item's attributes
- Adjusting single symbology solid color by picking a color from the color picker
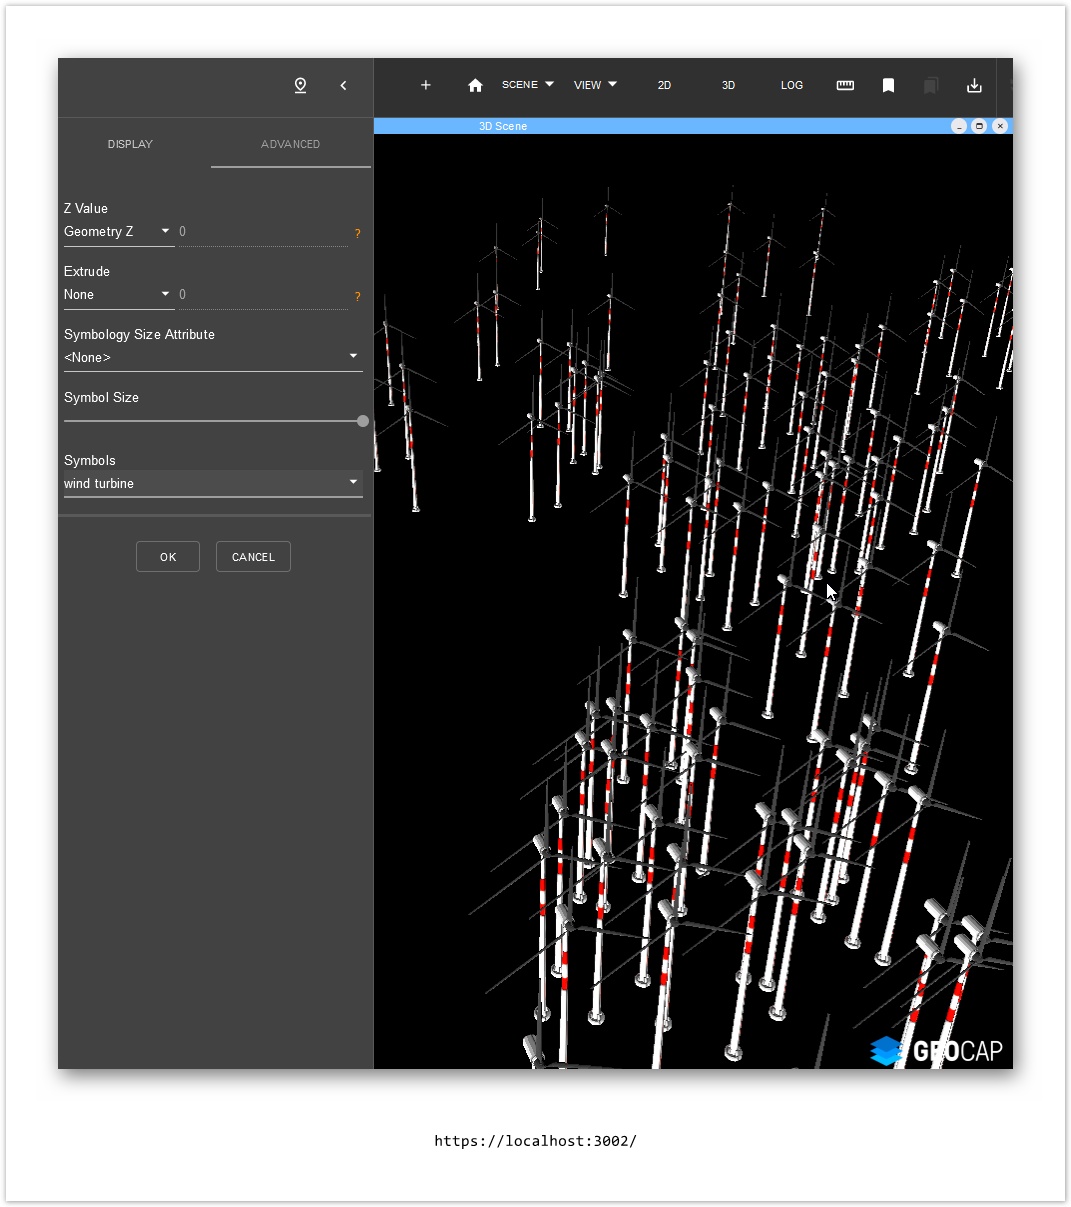
- The ADVANCED tab provides:
- Determining how the Z coordinates of the features are calculated
- Determining how the feature geometry is extruded
- Adjusting symbology size by picking one of the provided size schema available in the item's attributes
- Adjusting general symbol's size regardless of chosen size schema
- (optional function available only for points) Switching among available symbols to change shape representing a single point