Web Client
- Anders Moe
- Łukasz Wiszniewski
- Andreas Paulsen (Unlicensed)
Introduction
This section describes how to set up your seismic portal using the Seismic Server web client as well as basic usage. An example of what your seismic portal could look like can be found by visiting the official Geocap Seismic Portal.
Who this is for
This section is for anyone involved in setting up GIS web applications and who wishes to add seismic data to the map. Basic familiarity with creating a web page or using ArcGIS web maps is assumed. This section does not cover how to load seismic into ArcGIS and publish the data.
Capabilities of the web client
The web client is technically a web app builder widget that is installed along with any other widgets in your web app created using the web app builder.
The widget comes with the following features:
- A 3D window for showing seismic, features and rasters in 3D. This data is accessed from ArcGIS services, including the Geocap Seismic Server.
- A 2D cross-section window for showing seismic cross-sections along with intersections between the seismic and other data.
- The ability to measure 2D and 3D distance along with any object in the scene
- Interact with the standard ArcGIS web map including copying data from the map to the Geocap 3D display
- Change visualization properties
- Supported data types are :
- 2D + 3D seismic
- Features
- Rasters, including mosaics, server from an ArcGIS Image Server.
A PC is the recommended device on which to interact with the client. Mobile devices will work but some gestures like 3D seismic section movement will require a notebook-sized screen to be useful.
Prerequisites
This section assumes that you already have a Seismic Server setup with data loaded. It also assumes familiarity with ArcGIS Portal and how to use the web app builder in the portal to create web apps.
Creating a seismic web app
- Once you have access to the Geocap Viewer widget follow the ArcGIS Portal documentation on how to add custom widgets.
- From the portal create a web app using the web app builder
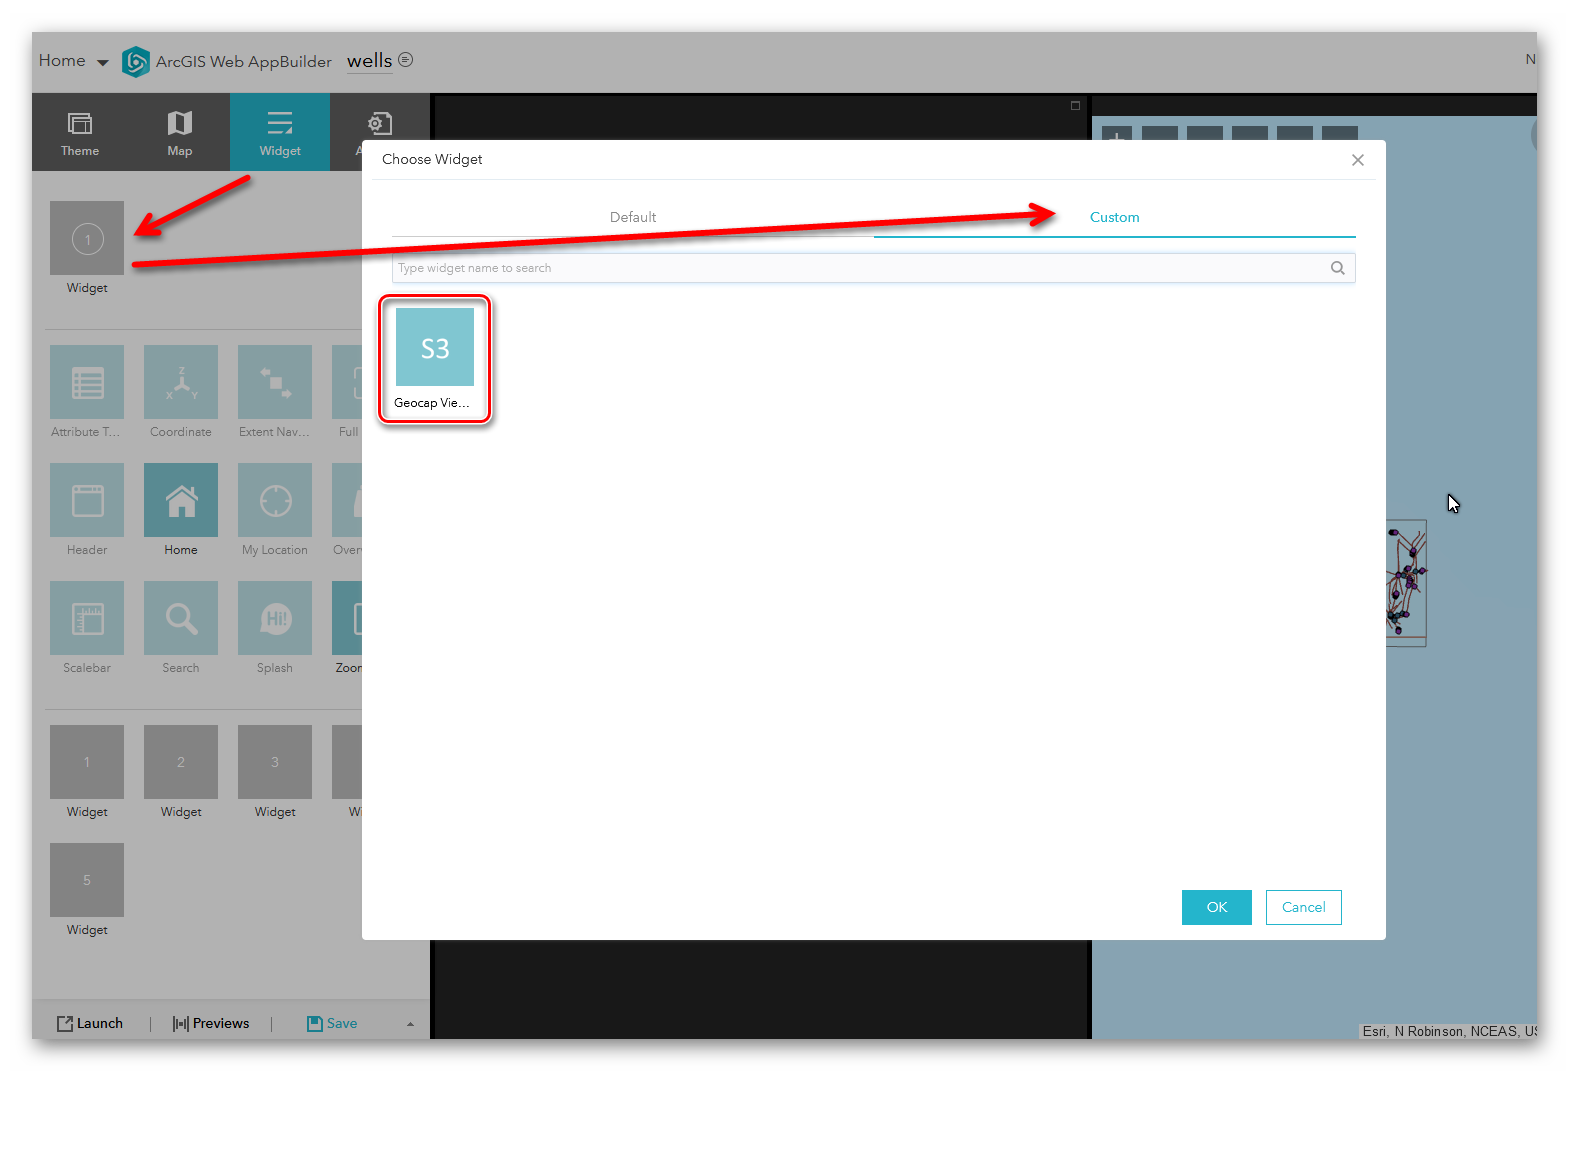
- When adding widgets from within the web app builder click the Custom tab in the widget dialog. The Geocap Viewer widget should be listed. Just clicking the defaults should be ok.
- The next step is to configure the Geocap Viewer. In the startup scene input, you can optionally choose the JSON file with your previously saved bookmarks in Geocap Viewer by clicking the Browse button. The required input is the Location of Geocap JS which is supposed to be used to link to the geocap.js file.
A note on themes.
All web app builder themes are supported. However, some themes place the widgets in a fixed narrow location on either side in a way that does not work well with the requirements the Geocap viewer has for screen space. Also, the creation of two instances of the Geocap viewer in the same app is not supported.
Geocap viewer usage
This section describes the basics of how to use the Geocap web client. Some details differ depending on whether you have decided to embed it as a WAB widget or as a standalone component in your web page.
Adding Data
To add data directly from an ArcGIS service:
- Click the + icon on the toolbar and click Add Data from Web.
- Enter the URL of the service that you wish to add and click OK. You may need to check the Perform Login button to access restricted services. Here are some example links that you may try:
If you're using an ArcGIS web app created using the Web App Builder you can add data from the map in two different ways, as follows:
- In the Geocap viewer interface. Click the + icon on the toolbar and click Add Data from Map:
- All to add all layers from the map to the Geocap viewer table of contents (TOC), or
- Rasters to add all rasters from the map to the Geocap viewer table of contents (TOC)
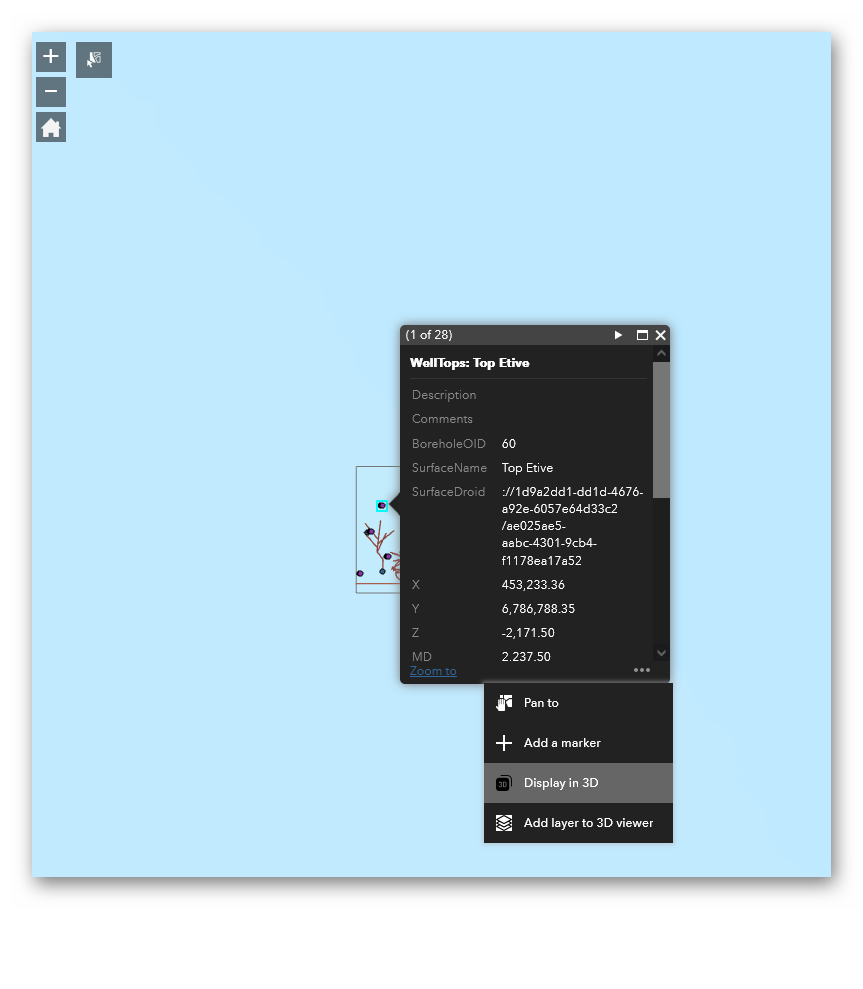
- From the map. Select a feature on the map and click the ... icon on the bottom of the pop-up window and choose:
- Display in 3D. It will add a single clicked feature to the Geocap viewer table of contents (TOC), or
- Add layer to 3D viewer. It will add an entire layer that includes the selected feature.
Manipulate view and windows
The Geocap viewer contains three types of windows: 3D, 2D, and Log viewer. They can be manipulated in the same way as in most graphical operating systems, like Microsoft Windows.
Possible operations:
- moving each window independently by dragging the name bar of a specific window
- resizing windows
- minimizing, maximalizing, and closing
- snapping windows by dragging or resizing the window in the way one of the edges is close to an edge of another window until the edge changes color to blue; to unsnap just resize one of snapped windows from the corner of the snapped (blue) edge or drag on of snapped windows
- double-clicking on the name bar of a window to maximize or restore the previous window's size
Predefined windows positions (tile, side by side) are available in the toolbar's View pulldown menu.
The Geocap viewer has also useful visual functionalities available in the View pulldown menu:
- Scenic Effects visualizes seawater level and the sky
- Color Legend describes colors displayed in 3D view by numbers
- Axis visually grids the spatial data
Saving Scenes and bookmarks
The Geocap viewer lets you store scenes for later retrieval. The scenes are stored as JSON files and can be loaded from the local filesystem or configured in the widget. Retrieving a scene will reload the graphics and the table of contents (TOC).
To save a scene:
- Load and visualize the data that you wish to save
- Click the Save Bookmark icon on the toolbar to save the current view. You may save any number of views. To restore a particular view just click on one of the thumbnails (View Bookmarks icon).
- To save the whole scene to a file click the Download Scene icon on the toolbar. The scene will be saved to a JSON file on your PC (default download location of your web browser).
To restore a scene interactively:
- Click the + icon on the toolbar and click Load Scene.
- Choose whether to load the scene using a remote URL or local file.
To restore a scene in a web app:
- Configure the Geocap Viewer widget from within the web app builder. In the section Startup Scene upload the scene JSON file.
Viewing Seismics
To view seismic data:
- Publish the data to the server and add the URL for the seismic layer as described in the section on adding data.
- Ensure that both the layer item and child feature items are checked in the table of contents (TOC).
- To view seismic in 3D click the 3D button in the toolbar to ensure that the 3D view is visible.
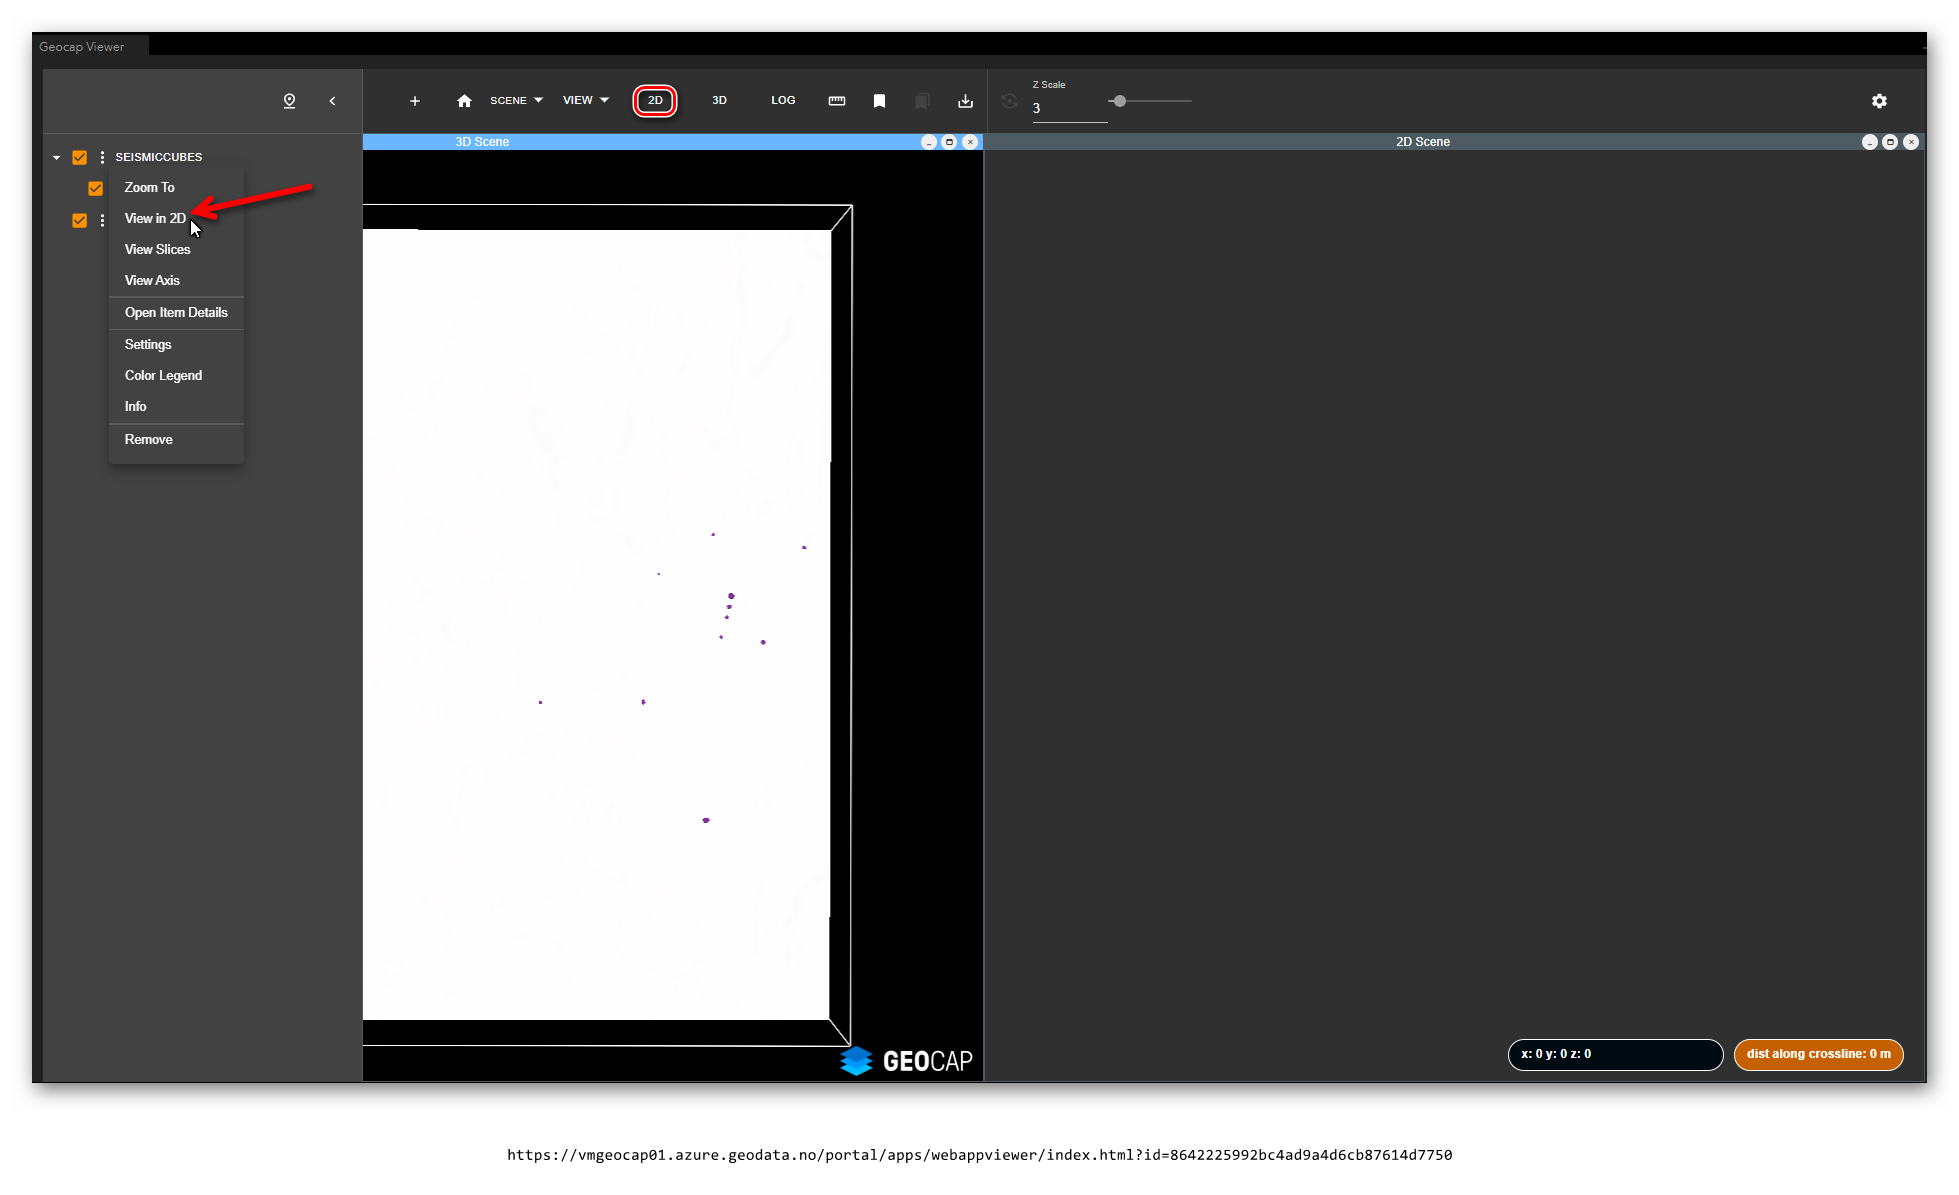
- To view seismic in a 2D cross-section click the "..." pulldown menu in the table of contents (TOC) for the seismic item and click View in 2D. Make sure the 2D window is opened, if not then click the 2D button in the toolbar.
- If necessary click the "..." button for the seismic item and click zoom to. The seismic should appear.
- When using 3D seismic you can move the section by moving the section sliders. The section sliders will appear if you:
- Click on the text for the seismic item in the table of contents (TOC)
- -or
- Click the "..." pulldown menu for the item and click View Slices.
Viewing Rasters
The web client supports visualization of both ArcGIS Image Services, Raster Layers, and Map Services. Rasters can be displayed using various modes:
- Flat or as elevation rasters.
- By themselves or draped on top of another elevation surface.
Map Services can be displayed in one of two modes, set when adding the service to the viewer:
- View the service as a single raster that is the combination of all the layers in the service. This corresponds to the conventional 2D view of the map.
- View the layers in the map service individually.
When adding map services these display options are set by checking either the Add as map raster option or the Add individual map service layers options in the Add Data dialog ('+' button → Add Data from Web).
If viewed in elevation mode band 0 of the raster is assumed to contain elevation values representing z values.
By default rasters with 3 or 4 bands (typically RGB) will be displayed in flat mode, while rasters with one band will be assumed to be elevation rasters.
One raster may be draped on top of another. Typically an RGB satellite image will be layered on top of an elevation surface.
To drape one raster on another:
- Have both rasters loaded into the viewer
- Click the "..." pulldown entry on the raster that you wish you drape and click settings.
- In the elevation entry select Elevation
- In the Elevation Raster entry select the elevation raster into which the raster should be draped.
- Click OK.
Folders
The Table of Contents (TOC) in the web client supports folders for hierarchical storage of items. These folders live in the client only and do not reflect any underlying data storage structure.
To add a folder:
- Click '+' in the toolbar and then New Folder.
To move items in the TOC to a folder:
- Click the '...' pulldown menu and click Move to...
- Select the target folder.
Measuring
The web client supports distance measuring in 2D and 3D.
To perform measuring:
- Click the measure icon ("ruler") in the toolbar
- Click on the first point to include in the measuring segments
- Double click to finish the measuring session.
The measuring dialog contains the following information:
- Measuring method: Choose whether the distance between the selected data points is calculated using planar or geodetic calculation.
- Horizontal unit: The unit used for horizontal distances
- Horizontal path distance: The total horizontal distance of all line segments. No depth distance is included.
- Horizontal net distance: The horizontal distance between the first and last measuring points. No depth distance is included.
- Vertical net distance: The pure vertical distance between the first and last measuring points. No horizontal distance is included.
When the scene is set in either WGS-84 (wkid: 4326) or Web Mercator Auxiliary Sphere (wkid: 3857) it is recommended that you use the geodesic method of calculation. For projected coordinate systems planar is often an acceptable alternative.
To change the spatial reference of the scene:
- Click the toolbar cogwheel to open the settings dialog to set the spatial reference
- -or
- Click the pulldown menu for the TOC item that you wish to adjust to. Click Use this spatial reference to set the scene to use the spatial reference associated with the selected item.
Note that geodesic measurements on scenes set to a projected coordinate system may sometimes fail due to restrictions in the underlying projection software used.
A note on vertical units in the measurement
For non-seismic data Geocap generally does not know the z domain (time or depth) or vertical units for a dataset. Geocap performs the vertical measurement based on the z values as-is. When performing measurements on a single dataset or a group of datasets with the same vertical unit this is typically not an issue. However, if a single measurement is performed across several datasets with mixed vertical units the reported value will generally be incorrect. The user is advised to be mindful of this when performing depth measurements.
Seismic Settings panel
Loaded in the table of contents (TOC) seismic data provides a bunch of settings options available in the '...' pulldown menu of a single seismic item.
- The DATA tab provides seismic values adjustments
- The DISPLAY tab provides:
- Displaying transparency adjustment
- Data filtering
Raster Settings panel
Loaded in the table of contents (TOC) raster data provides a bunch of settings options available in the '...' pulldown menu of a single raster item.
- The DATA tab provides:
- Trimming of visible date in 3D view by viewport/3D window borders
- Adjusting elevation method
- Applying an elevation raster
- Adjusting displaying of the data by providing limit lines on the histogram
- The DISPLAY tab provides:
- Displaying transparency adjustment
- Data filtering
- Coloring method: shading single color or gradient
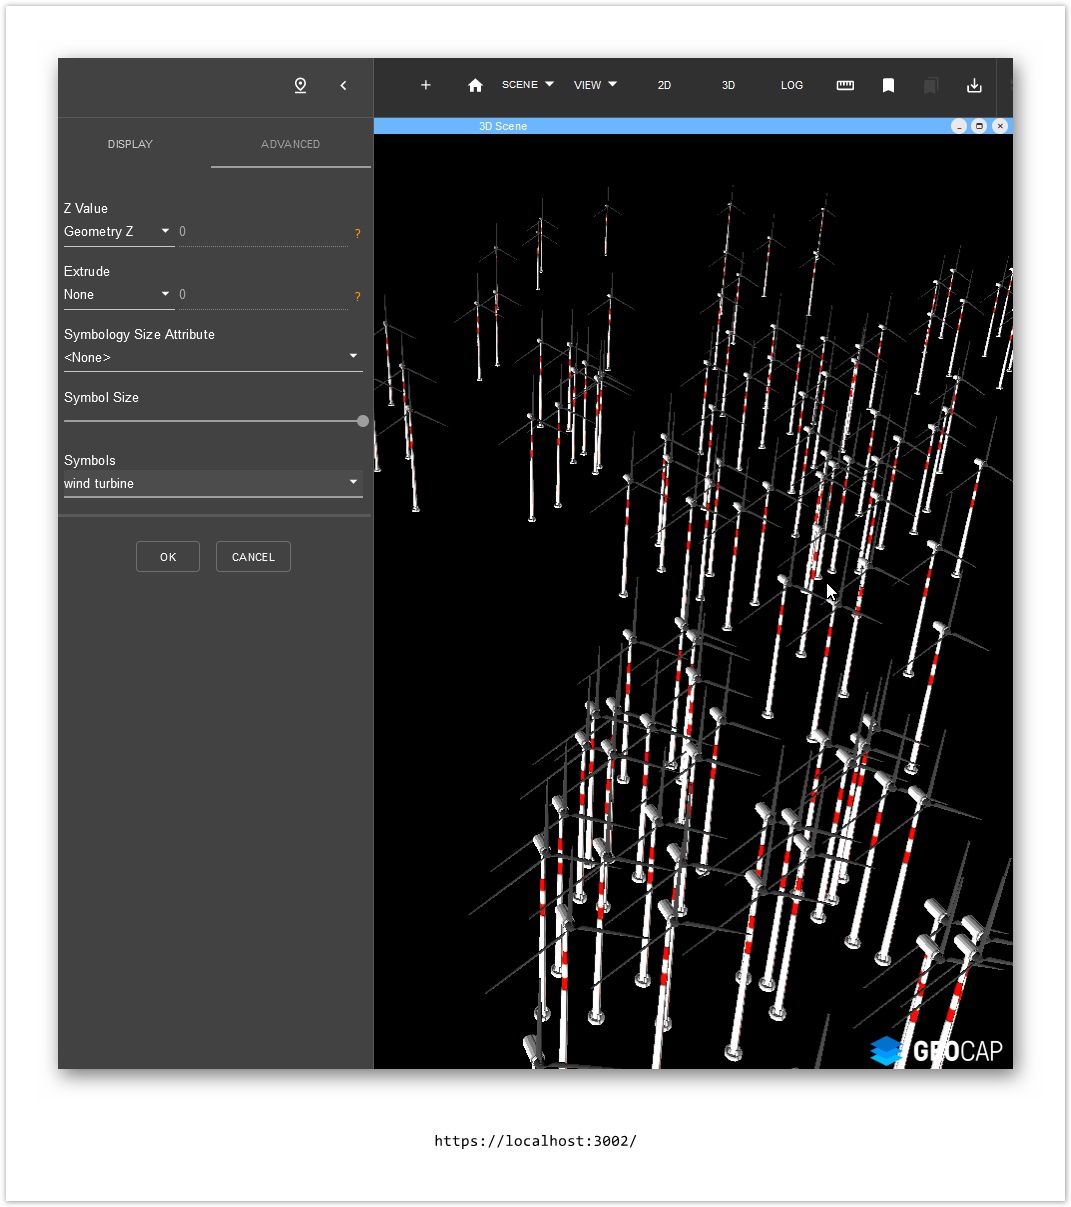
Feature Settings panel
Loaded in the table of contents (TOC) raster data provides a bunch of settings options available in the '...' pulldown menu of a single raster item.
- The DISPLAY tab provides:
- Displaying labels
- Adjusting symbology colors by picking one of the provided color schema available in the item's attributes
- Adjusting single symbology solid color by picking a color from the color picker
- The ADVANCED tab provides:
- Determining how the Z coordinates of the features are calculated
- Determining how the feature geometry is extruded
- Adjusting symbology size by picking one of the provided size schema available in the item's attributes
- Adjusting general symbol's size regardless of chosen size schema
- (optional function available only for points) Switching among available symbols to change shape representing a single point