Geocap Javascript API
- Anders Moe
Introduction
The Geocap Javascript API allows web developers to create client-side software that connects to the Subsurface Portal for ArcGIS. This will typically be web pages that performs 2D and 3D rendering of seismic data. With the Geocap Javascript API anyone can create web pages that perform sophisticated seismic visualization using only a few lines of code.
Features of the Javascript API :
- Modeled after the ArcGIS Javascript API, it has a design that should be familiar to ArcGIS developers. It has no dependencies on the ArcGIS Javascript API however, leaving you free to use your own GIS framework of choice.
- Based on Dojo, the API uses established Dojo mechanisms like AMD module loading, classes and promises to provide a coherent underlying infrastructure.
- Has a clear separation between data and visualization. The API is sufficiently high-level to make it easy to develop standard solutions, while also providing low-level data loaders for developers who wish deal with the data directly. The API shields the developer from the mechanics of low-level WebGL.
Requirements
On order to use the Geocap Javascript API you will need a running Subsurface Portal for ArcGIS. Your web browser must also be capable of WebGL rendering with hardware supported graphics acceleration.
Some specifics:
- Internet Explorer. Use version 11.
- Chrome. Later is better. Open the Settings → Advanced page and ensure that the Use hardware acceleration when available option is checked. Open the chrome://gpu/ page and ensure that hardware acceleration is used for the various features. Note : Some reports indicate that enabling hardware acceleration leads to other performance issues when using Chrome such as mouse lag and problems with scrolling. If you experience this you may have to disable hardware acceleration, although this will reduce the WebGL performance as used by the Geocap Javascript API.
- Firefox. Later is better. Open the Settings → Advanced page and enable the Use hardware acceleration when available option.
- Safari. Supported.
Prerequisites
In order to run the examples in this section you must have a Subsurface Portal for ArcGIS running with at least one 3D or 2D survey installed. Also you should have access to the Geocap Javascript API either as a separate download or a URL.
Getting started
The following example shows the Javascript required to fetch a seismic 3D volume from a server and display in a 3D view. See Example 1 : Simple Cube for the complete example.
<body>

    <canvas id="sceneArea"></canvas>
    <script>
        require(["geocap/Scene", "geocap/FeatureLayerDataSource",
            "geocap/Seismic3DDataSource", "geocap/Seismic3DSectionControllers", "geocap/View3DThree",
            "dojo/parser", "dojo/domReady!"],
            function (Scene,
            FeatureLayerDataSource,
            Seismic3DDataSource,
            Seismic3DSectionControllers,
            View3DThree,
            parser) {

                // URL to map service
                var mapserver_url = "http://localhost:6080/arcgis/rest/services/Peon/MapServer";


                // Survey outline feature. This just shows the survey outline, not the data
                var peon_outline = new FeatureLayerDataSource({ url: mapserver_url, layerid: 0 });

                // Get all features in feature layer
                queryparams = {
                    f: "json",
                    returnZ: true,
                    where: "objectid > 0",
                    returnGeometry: true,
                }

                peon_outline.setQueryParameters(queryparams);

                // Seismic 3D data (amplitudes). The survey of interest corresponds to feature with OID = 1
                var seismics3d = Seismic3DDataSource({ url: mapserver_url, layerid: 0, surveyid: 1 });

                // Create scene to hold data
                var scene = new Scene();


                // Add data to scene
                scene.addFeatureLayer(peon_outline);
                scene.addSeismic3D(seismics3d);

                // Create 3D view for scene and insert it in given DOM element
                var c = document.getElementById("sceneArea");
                var view = new View3DThree({ scene: scene, canvas: c });

                // Exaggerate Z to make the display more interesting
                view.setZScale(5);

                // Lets look at the area of the survey
                view.zoomToDatasource(peon_outline);

                // Call this before using Seismic3DSectionControllers
                parser.parse();

                // The range controller call method in the view object telling it to show particular 3D volume sections
                // We there need to get hold of the view object and attach it to the controller
                var seismic_vo = view.getViewObject(seismics3d);
                var range_controller = dijit.registry.byId("rangecontroller");
                range_controller.setViewObject(seismic_vo);


            });

    </script>
    <!-- Sliders that move the 3D seismic volume sections -->
    <div id="rangecontroller" data-dojo-type="Seismic3DSectionControllers">    </div>

</body>
This will display a seismic 3D volume along with three simple sliders to move the sections.
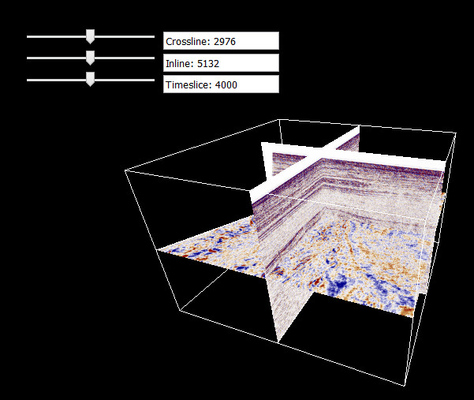
Lets examine this example in more detail.
<canvas id="sceneArea"></canvas>
In line 3 we create a HTML canvas element. This element serves as the element into which the WebGL rendering will take place. In line 46 you see this element being provided to the view object. You can position the canvas element anywhere in page like any other HTML element.
     require(["geocap/Scene", "geocap/FeatureLayerDataSource",
            "geocap/Seismic3DDataSource", "geocap/Seismic3DSectionControllers", "geocap/View3DThree",
            "dojo/parser", "dojo/domReady!"],
            function (Scene,
            FeatureLayerDataSource,
            Seismic3DDataSource,
            Seismic3DSectionControllers,
            View3DThree,
            parser) {
Here we see Dojo AMD loading mechanism used to load various modules contained in the API. The Geocap Javascript API is implemented as a set of classes using the Dojo class mechanism. The rest of this example will instantiate these classes in turn.
                // URL to map service
                var mapserver_url = "http://localhost:6080/arcgis/rest/services/Peon/MapServer";


                // Survey outline feature. This just shows the survey outline, not the data
                var peon_outline = new FeatureLayerDataSource({ url: mapserver_url, layerid: 0 });

                // Get all features in feature layer
                queryparams = {
                    f: "json",
                    returnZ: true,
                    where: "objectid > 0",
                    returnGeometry: true,
                }

                peon_outline.setQueryParameters(queryparams);
In lines 15-30 we connect to the feature layer that contains our survey outlines. The FeatureLayerDataSource uses the query capabilities of the underlying map service to fetch the necessary data, including extent and feature geometry. Therefore, the arguments provided to the queryparameters object correspond to the ones used by the ArcGIS query REST API. Note that the feature layer object used here is just used to provide the cube lattice surrounding the cube data. It makes for a more appealing display, but is not strictly required in order to display the seismics. The FeatureLayerDataSource object will show any feature layer and has no inherent knowledge of seismics.
      // Seismic 3D data (amplitudes). The survey of interest corresponds to feature with OID = 1
      var seismics3d = Seismic3DDataSource({ url: mapserver_url, layerid: 0, surveyid: 1 });
In line 33 we use the Seismic3DDataSource object to connect to a seismic 3D survey. In the seismic server this corresponds to a particular feature containing the survey outline. The surveyid : 1 argument tells us that the survey is the feature with OBJECTID = 1. The Seismic3DDataSource object will then be able to provide metadata and data (the amplitudes) for the survey.
 // Create scene to hold data
 var scene = new Scene();


// Add data to scene
scene.addFeatureLayer(peon_outline);
scene.addSeismic3D(seismics3d);
In line 36 we create the Scene object and add our data to the scene. The Scene object contains little functionality other than being a placeholder for various datasources, and is mostly used as input to the View object used to render the data.
// Create 3D view for scene and insert it in given DOM element
var c = document.getElementById("sceneArea");
var view = new View3DThree({ scene: scene, canvas: c });

// Exaggerate Z to make the display more interesting
view.setZScale(5);


// Lets look at the area of the survey
view.zoomToDatasource(peon_outline);
Here we see the instantiation of the View3DThree object, which will render our data in 3D using the Three.js render engine. By providing the existing Scene object as argument the view will have access to the data that is to be rendered into the canvas. In this case no spatial reference is provided to the view, so it will assume the default web mercator. If a particular coordinate system is desired you should provide the well-known ID as argument to the constructor, such as 'sref = 4326'.
                var seismic_vo = view.getViewObject(seismics3d);
                var range_controller = dijit.registry.byId("rangecontroller");
                range_controller.setViewObject(seismic_vo);


            });

    </script>
    <!-- Sliders that move the 3D seismic volume sections -->
    <div id="rangecontroller" data-dojo-type="Seismic3DSectionControllers">    </div>
Finally we create three sliders that will be used to move the seismic inline, crossline, and timeslice sections. Line 58 retrieves the so-called view object that represents the seismic cube. This object has methods for the display of the seismic sections, such as timeslice number 423. The Seismic3DSectionControllers is a simple Dijit widget that calls these methods based on the slider movement. You are free to create your own sliders or move the sections using other means as long as you call the corremt methods in the seismic 3D view objects.
Design
This section describes the underlying object oriented design used by the Geocap Javascript API.
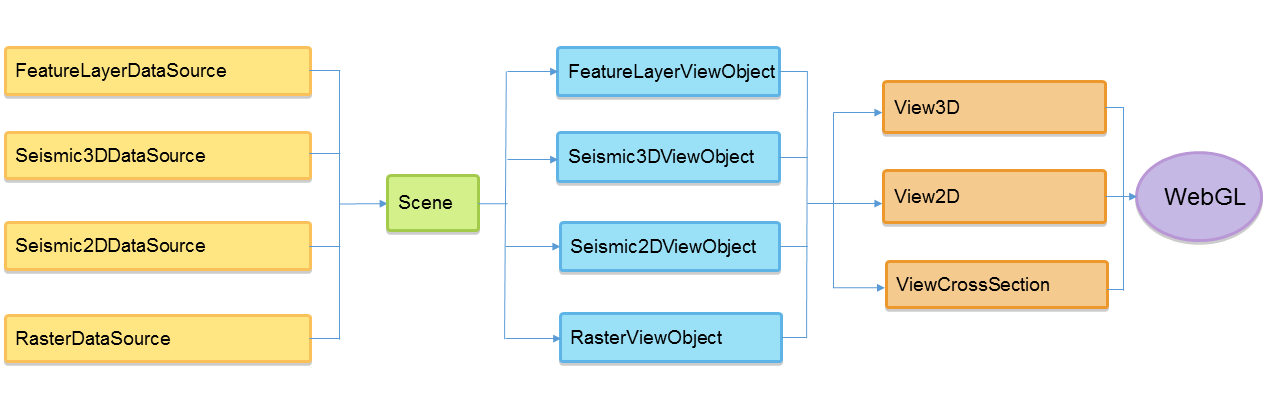
The above diagram shows a high level view of the rendering pipeline. The different datasources are collected in a Scene object, which in turn produces the corresponding view objects. The view objects direct the rendering of the input data into the target view. The views take care of transforming the incoming drawing commands to the underlying WebGL rendering engine. The datasources and the Scene object know nothing about graphics and rendering. Their task is to provide data and meta data to the view objects. They also manage spatial projections. A view is created with respect to a specific spatial reference and the view objects will ask the data sources to provide data in the target coordinate system.
We will now describe the classes in more detail. The main groups of classes are datasources, views and view objects.
- Data sources are similar to datasources as they are used in ArcGIS Desktop, ie they represent a connection to the underlying data. They provide metadata, the data itself, and can reproject on-the-fly. Datasources have no knowledge of graphics or rendering. All datasources inherit from the DataSource baseclass.
- View objects marks the transition from data to display. For each type of data source there is a corresponding view object. The view object keeps a reference to the data source, along with details on how the data is to be rendered, like color and line width. The view object then calls the rendering methods in the view object that are appropriate for rendering the particular type of data held by the view object. The relationship between view objects and datasources is similar to layers and datasources as used elsewhere in ArcGIS, i.e. a separation of data and display.
- Views are where the visual display takes place. They will manifest themselves as a portion of the screen containing the display graphics. There are different types of views. The View3D for example class will show a full 3D space with zoom and rotation, while classes based on ViewCrossSection will be locked to a 2D cross section display of a particular dataset, like a 2D seismic line. Views use the underlying 3D engine like Three.js to do the actual rendering. Views have no knowledge of data sources. They simply implement generic drawing mechanisms that are called by the view objects. The view object is tasked with converting these drawing commands to WebGL. All views inherit from the View baseclass. Also, views are subclassed according to the 3D engine in use, for example View3DThree implements a View3D using the Three.js rendering engine.
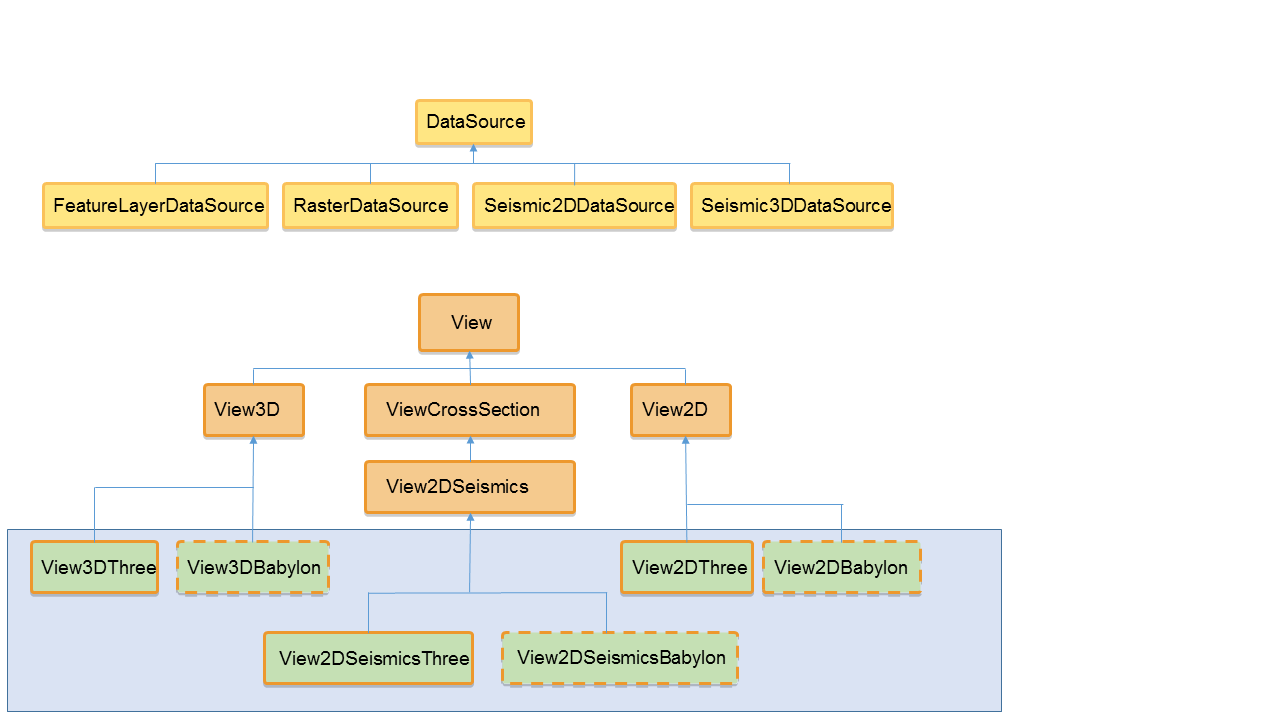
The above figure shows the hierarchical relationship between the subclasses of DataSource and View. The classes that implement specific 3D engines are filled with green. Note that the dotted Babylon classes are not yet implemented.
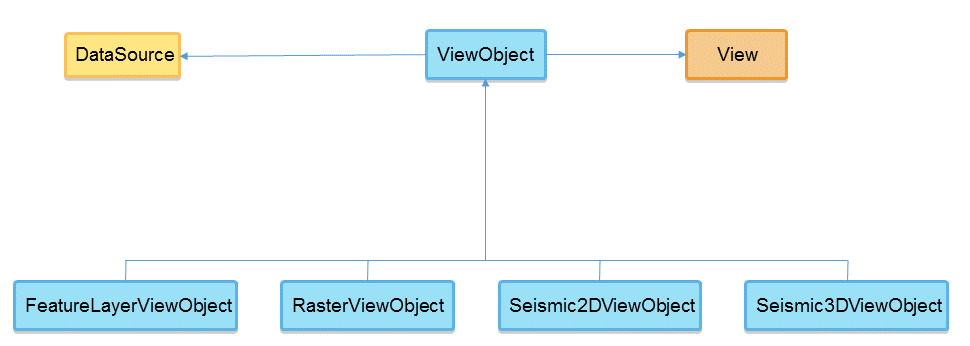
Each datasource type has a corresponding view object. The view object keeps a reference to the data source as well as the target view object into which the data will be rendered.
Examples
Example 1 : Simple Cube.
<!DOCTYPE html>

<html lang="en" xmlns="http://www.w3.org/1999/xhtml">
<head>
    <meta charset="utf-8" />
    <title>Peon</title>

    <!-- Avoid favicon error      -->
    <link rel="icon" href="data:;base64,iVBORwOKGO=" />


    <style>
        html, body {
            height: 100%;
            width: 100%;
            margin: 0;
            padding: 0;
        }

        #rangecontroller {
            position: fixed;
            top: 50px;
            left: 50px;
            width: 400px;
            height: 400px;
        }
    </style>


    <script>
        // Make dojo look here for geocap module. Include this BEFORE including dojo
        var dojoConfig = {
            parseOnLoad: true,
            async: true,
            packages: [
            { name: "geocap", location: "/js/geocap" },
            { name: "geocapshader", location: "/shader" }
            ]

        };
    </script>


    <script src="js/dojo-release-1.10.4-src/dojo/dojo.js"></script>

    <script src="js/three.js"></script>

</head>

<body>

    <canvas id="sceneArea"></canvas>
    <script>
        require(["geocap/Scene", "geocap/FeatureLayerDataSource", "geocap/Seismic3DDataSource", "geocap/Seismic3DSectionControllers", "geocap/View3DThree", "dojo/parser", "dojo/domReady!"],
            function (Scene,
            FeatureLayerDataSource,
            Seismic3DDataSource,
            Seismic3DSectionControllers,
            View3DThree,
            parser) {

                // URL to map service
                var mapserver_url = "http://localhost:6080/arcgis/rest/services/Peon/MapServer";


                // Survey outline feature. This just shows the survey outline, not the data
                var peon_outline = new FeatureLayerDataSource({ url: mapserver_url, layerid: 0 });

                // Get all features in feature layer
                queryparams = {
                    f: "json",
                    returnZ: true,
                    where: "objectid > 0",
                    returnGeometry: true,
                }

                peon_outline.setQueryParameters(queryparams);

                // Seismic 3D data (amplitudes). The survey of interest corresponds to feature with OID = 1
                var seismics3d = Seismic3DDataSource({ url: mapserver_url, layerid: 0, surveyid: 1 });

                // Create scene to hold data
                var scene = new Scene();


                // Add data to scene
                scene.addFeatureLayer(peon_outline);
                scene.addSeismic3D(seismics3d);


                // Create 3D view for scene and insert it in given DOM element
                var c = document.getElementById("sceneArea");
                var view = new View3DThree({ scene: scene, canvas: c });

                // Exaggerate Z to make the display more interesting
                view.setZScale(5);


                // Lets look at the area of the survey
                view.zoomToDatasource(peon_outline);

                // Call this before using Seismic3DSectionControllers
                parser.parse();

                // The range controller call method in the view object telling it to show particular 3D volume sections
                // We there need to get hold of the view object and attach it to the controller
                var seismic_vo = view.getViewObject(seismics3d);
                var range_controller = dijit.registry.byId("rangecontroller");
                range_controller.setViewObject(seismic_vo);


            });

    </script>
    <!-- Sliders that move the 3D seismic volume sections -->
    <div id="rangecontroller" data-dojo-type="Seismic3DSectionControllers">    </div>

</body>

</html>