GIM Visualization
- Erlend Kvinnesland
Introduction
GIM offers several ways to visualize trackings and surfaces depending on what you are looking for and want to achieve.
On this page:
Tracking scan
The tracking scan is an excellent tool for evaluating the tracking dataset and see how the stratigraphy in the cube is represented by the tracking. The tracking scan displays a set of inline or crossline trackings with a short time interval, and then displays the next set, making it look like a movie is played through the tracked cube.
Open the tracking scan from GIM > GIM Data Visualization > Surface Interactive. Select Seismic Dataset and Surface Dataset.
![]()
Tracking scan menu
Select the seismic dataset, inline tracking or crossline tracking and select the tracking dataset. Adjust the parameter settings to your need:
- Maxium trackings number
Sets the number of trackings displayed at the same time.
- Initial display time interval
Sets the time a set of trackings will be displayed before the next set is displayed. A low number will increase the speed of the scan and a high number will slow it down.
- Display order
Sets which direction the trackings should be displayed in.
- Start tracking slice/End tracking slice
Sets the scan range. Default is the whole cube.
- Tracking interval
Sets the amount of trackings to load within the scan range. Default is set to the interval in your tracking dataset. By increasing this number you will reduce the amount of trackings loaded.
- Display type
Sets the color of the trackings. Decide on a single color by using Monochrome, use a different color for each tracking slice with Cyclic or color by amplitude by using Map.
Start the scan by clicking the play button. You can pause or stop the scan anytime. Use the plus and minus buttons to increase and decrease the speed. You can also set the scan to loop, which makes it start over again when it has reached the end. To manually scan through the trackings click the pause button and use the arrows to go back and forth.
Surface scan
Scanning through a GIM surface database is an effective way to familiarize oneself with the 3D stratigraphy. It is also a very effective way to looking through the entire cube evaluating the surfaces based on relief, attribute and shape. The surface scan is most often used to display all surfaces or a set of surfaces in a series, or by displaying surfaces one-by-one.
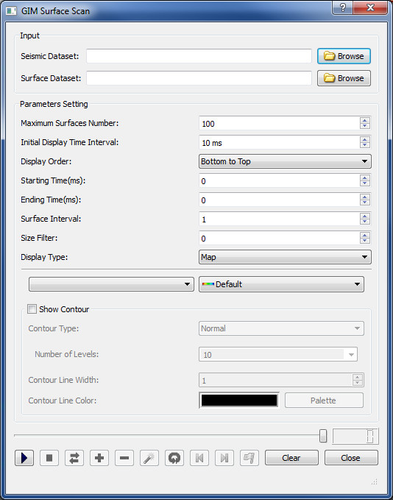
Open the surface scan from Tools -> GIM Data Visualization -> Surface Scan. Select Seismic Dataset and Surface Dataset.
Surface scan menu
Parameter settings
- Maximum surfaces number
The number of surfaces allowed to be displayed at one time.
- Initial display time interval
The time a surface will be displayed before the next one is displayed. A low number will increase the speed of the scan and a high number will slow it down.
- Display order
Surfaces can either be displayed from bottom of the cube to the top, or from the top of the cube and down.
- Starting time
The upper time constraint (z-value) in which to load surfaces. Default value is top of the cube, which in most cases would be 0.
- Ending time
The lower time constraint (z-value) in which to load surfaces. Default value is the bottom of the cube.
- Surface interval
The interval of surfaces to display. If set to 2, only half of the surfaces will be loaded.
- Size filter
The minimum size for a surface that are to be displayed. If set to 0, all surfaces are loaded. A normal value would be 1000, in order to avoid all the small surfaces.
- Display type
Surfaces can be mapped on time or attribute, or displayed in a single color.
Enable contours by checking the Show contour box and adjusting the appropriate parameters.
Scan one-by-one
The best way to scan through the surfaces one-by-one is to look at them from above in 2D mode. Display the outline of the cube and set the graphics window in 2D. In order to scan through the surfaces set the Maximum surfaces number to 1 and the size filter to 1000. Set the display type to map surfaces with time.
Start the scan by clicking the play button, and Geocap will display the first surface. If you have generated amplitudes for the surfaces you can switch between displaying time and amplitude by pressing N on the keyboard. Go to the next surface by clicking the  button or the right arrow on the keyboard. Go back with the
  button or the left key on the keyboard.
Tag interesting surfaces by pressing T on the keyboard or the  button in the surface scan menu.
Display multiple surfaces
It can often be valuable to display several or all of the surfaces to get familiarized with the 3D surface database. A good way to do this is to display the 500-1000 biggest surfaces. The appropriate settings required to achieve this will of course vary from cube to cube, but a good starting point would be to set the size filter to 2000 and the maximum surface number to 1000. Click the play button and wait for the surfaces to start loading. This can take some time depending on the speed of your computer.
When the surfaces have been loaded Geocap will start displaying them. You can see the amount of surfaces loaded at the bottom of the GIM surface scan menu.
If the number of loaded surfaces is:
- Less than 500
Try reducing the size filter to 1000. You need to re-load the surfaces by clicking the stop button and then the play button again.
- 1000
It probably means that Geocap stopped loading surfaces before reaching the top of the cube because of the maximum surface number. Try to increase the size filter to 3000, or increase the maximum surface number if you want to load more than 1000surfaces.
Surface interactive
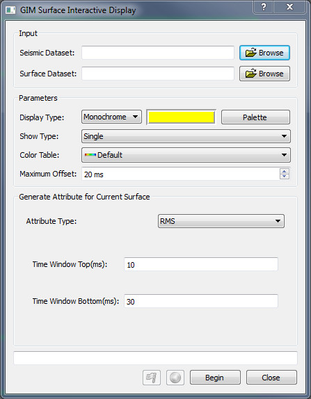
Surface interactive lets you display surfaces by clicking on seismic reflectors in the graphical window. Go to Tools > GIM Data Visualization > Surface Interactive. Select Seismic Dataset and Surface Dataset.
Surface interactive menu
Adjust the following parameters to your need:
- Display Type
Map time or attribute, display in a single Monochrome color or display in different colors using Cyclic. - Show Type
If set to Single the previous selected surface will be removed before displaying a new surface. Multi will keep displayed surfaces in the graphics window when displaying new surfaces. - Color Table
Sets the color table used when mapping a surface. - Maximum Offset
Sets the time interval above and below your pick where it will look for surfaces.
To start displaying surfaces interactively click Begin and go to the graphics winodow. Display a surface by positioning the cursor on a reflector and clicking Y on the keyboard.
It is possible to create attributes, such as amplitude, RMS and facies on picked surfaces. Select attribute type and parameters and click the  button.
It is also possible to tag surfaces for export to disk, project etc. Click the button to tag a surface.
From list
Display from list is great to use when you want to display the tracking for a specific inline or crossline, or display a specific surface which you know the number of.
Select a Seismic dataset and then Inline tracking, Crossline tracking or Surfaces as type, and select the dataset. Select one entry (tracking slice or a surface) to display and click Display. For tracking data you can display Horizon, Positive through or Negative peak. Select the color by using the Palette. For surfaces you can Map by time or attribute, or display in a single color by using Monochrome.
You can send one or several datasets from the list to the Geocap project by right-clicking them and select Send to project.