Seismic, Navigation and Velocities
Introduction
Many projects start from interpretation of seismic sections. These lines may be imported from external interpretation systems. In any case it is necessary to view them together with the seismic. Thus the SEG-Y seismic have to be imported. Likewise with stacking velocities and navigation lines if necessary.
Read about Importing SEG-Y and Importing Velocities in the main documentation.
The exercise require a training dataset that will be distributed and used in courses. Otherwise one can download it from Tutorial data1 .
Exercises
2D SEG-Y
The demo dataset contains numerous seismic 2D lines. In this example, the user will import seismic lines from 2 different seismic 2D surveys. (Note: It was previously four, but for rational reasons it is cut down to two).
Import 2D SEG-Y files
- Create 2 sub-folders in your Seismic Data folder called Survey3 and Survey4.
- Right-click on the Survey3 folder and select Import > SEG-Y 2D...
- Browse in the first file in the \inbox\03Seismic\S3_UTM50S folder, to investigate the format settings before reading all the lines.
- Set Storage to 8 bit (1/4 of the disk space – same resolution).
- Set Shot point to byte position 5-8 (typical Kingdom export).
- Set Step/Interval to 3 (1/3 of the disk space – same resolution).
- Press the Scan button and select the Scan results tab.
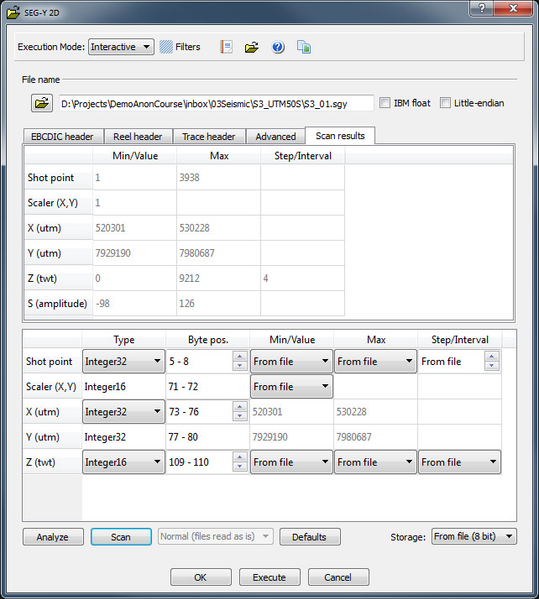
- Check that the X and Y coordinates, Z and shot points looks reasonable.
- Browse in all the SEG-Y files in the \inbox\03Seismic\S3_UTM50S folder.
- Click Execute and close the dialogue when completed.
- Repeat this procedure for Survey 4
The seismic data supplied is located in UTM zone 50S. This means that you have to convert it to 51S in order to be able to display the data together with the other data in the project.
Seismic Navigation
Import navigation files
Preparations
- Create a generic folder called Navigation and create 2 sub-folders called Survey3 and Survey4.
- Since we are going to need a similar folder structure for velocities, right-click the Navigation folder and select Copy
- Paste the folder into the project using the
 in the project toolbar.
 - Rename the new folder to Velocities
Import
- Right-click the sub-folder Survey3 in Navigation and select Import > UKOOA Lat Lon.
- Browse for the UKOOA_Survey3.asc file in the \inbox\04Navigation folder.
- We are using fixed columns.
- Make sure the Adjust header is set to 0.
- Make sure the Column1 width is set to 15.
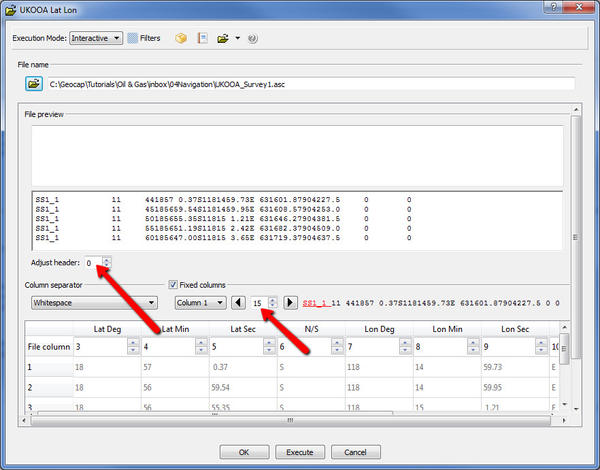
- Click Execute and close the dialogue.
- Repeat this procedure for Survey4
All the navigation is in geodetic coordinates (latitudes and longitudes), and therefore need to be converted to UTM 51S.
Seismic Processing Velocities
Import processing velocities
- Right-click the sub-folder Survey3 in Velocities and select Import > Stacking Velocities (no navigation).
- Browse in the Survey3_Esso.vel from the \inbox\05Velocities folder.
- Adjust the header setting to 3.
- Set the Velocity column to 7.
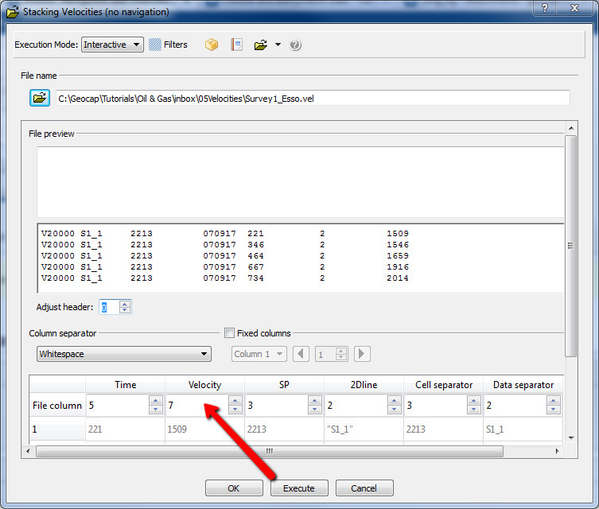
- Click Execute and close the dialogue.
- Repeat the procedure for Survey 4 .Be aware that for Survey3 and 4, there is a 3‐line header that needs to be set using the Adjust header option.
Assign navigation to velocities
- To assign navigation to to the velocities one needs a command menu called Assign Navigation. If not present in the set of Commands, get it from the repository and place it into Shared > Operations.
- Highlight the survey folder and execute Assign Navigation. Select the folder you want to assign navigation from. In the assigned folder only names that are matching the names of the velocities will be used. Thus name matching is essential for the whole assignment.
Merge velocities
Merge (or append) velocities means to collect all the single velocity dataset into one dataset. This is done for convenience when stacking velocities are input to gridding a time velocity cube.
- Apply the command Append all lines in a folder. The result is called appendedData and is located in workspace. Transfer in into the project; give it a proper name; ie.e all_lines; and set the schema to Stacking Velocities.
- You can append all data under a top folder. If you have to do the operation several times you may temporarily place the appendedData in a temp folder or use the shell command mhi/mlo data app directly into a collecting dataset.
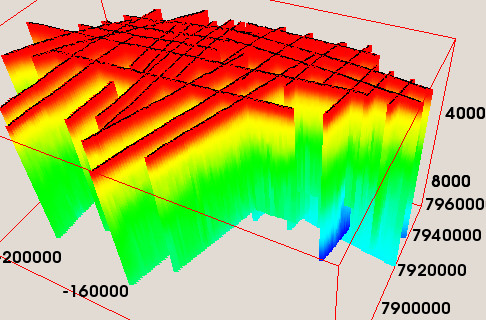
- Map the collected set called all_lines to see and confirm it is correct. Apply also Display survey lines for better visualization.
Stacking velocities