10. Multibeam Water Column data
- Tore Sannes (Unlicensed)
In this section:
Note: This functionality will be avalaible in the Geocap 7 release version.
Introduction
This section contains the documentation on how to import, display and process Water Column Data from Multibeam echo sounders. All the operations are performed from a folder of schema type Multibeam in a Geocap Seafloor project.
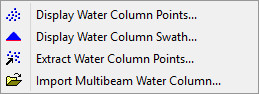
The tools for processing water column data are found as a sub menu on the Multibeam type folder's right click menu, under the tools folder named Water Column.
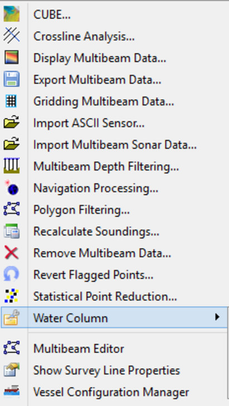
The Multibeam folder menu with the water column tools
Typical workflow
- Before loading the water column data the survey line must have an entry in the project. This means the depth data for the same survey line first must be imported by the command Import Multibeam Sonar Data.
- The import of water column data is done with the command Import Multibeam Water Column Data. The import can be time consuming dependent on the size of the file.
- To visualize the water column data, use the command Display Water Column Swath. This will display both the swath and optionally the alongtrack of the water column data. This command exist on both the Multibeam schema type folder and the Multibeam Survey schema type folder.
- To convert the water column swath data to point cloud data, use the command Extract Water Column Points. This command will extract features and filter away much of the noise in the swaths.
- To visualize the extracted point cloud data, use the command Display Water Column Points.
Import Multibeam Water Column Data
This command will import water column data to Multibeam Survey type folders already loaded in the Multibeam type folder.
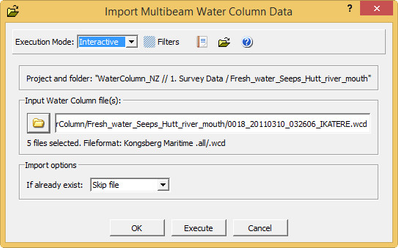
The Import Multibeam Water Column Data dialog
The content of the menu
The upper part of the menu shows the name of the project and folder the command is activated from.
The Input Water Column file(s) part:
Click the open folder button to browse for the selected files. The file type filter shows available formats:
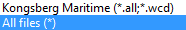
The available multibeam water column formats
The Import Options part:
- If already exists decides what strategy to use if the survey line already is imported. Skip file means do not read the file, Make duplicate will import the file and make a unique name, and Replace will delete the existing survey line and make a new import.
Click the Execute button to start the import. The import will take some time dependent on the size of the water column data file. The name of the specified file will be checked against the survey lines in the project, and if there is a match the line will be read.
After the import is finished a report will be shown and saved in the Report folder in the Multibeam type folder.
The format of the loaded water column data set will be as a Geocap Brick cube. This will allow fast visualisation of the huge data sets from the water column data file.
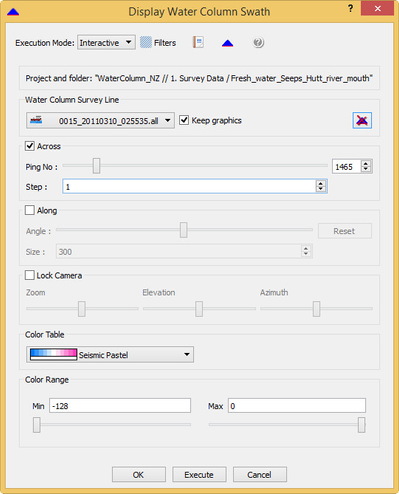
The Display Water Column Swath dialog
Display Water Column Swath
This command is executed from folders with schema type Multibeam and will display the water column data (swath) from the selected dataset. The command can also be opened directly from a Multibeam Survey line.
The content of the menu
The upper part of the menu shows the name of the project and folder the command is activated from.
The command's menu is split into five parts: Water Column Survey Line, Across, Along, Lock Camera, Color Table and Color Range.
After selecting the survey line, click the Execute button to visualize the water column data.
The options Across, Along, Lock Camera, Color Table and Color Range are interactive, so when changing the values the graphics will change immediately.
Several water column data sets can be displayed by the command, but only the one selected can be manipulated at the time.
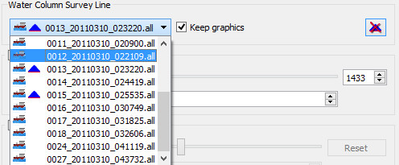
The Water Column Survey Line part
When opening the command from a Multibeam Survey line this part of the menu is missing.
- The pulldown menu will show survey lines containing water column data. The dataset item in the survey line is named Water Column. Click the Execute button to activate the display.
- When a survey line is displayed, the Display Water Column Swath icon (
 ) will appear in front of the name:
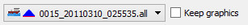
- Keep graphics: When this option is clicked it is possibel to select a new survey line to display and keep the graphics of the previous.
The pulldown will show all the survey lines which are displayed when the Keep graphics is turned on.
- Clicking the
 button will remove all water column displays in the actual folder.
The Across part
- Across: The check box allows for showing the across line from the water column cube. The across line is also called the Swath.
- Ping No : The slider allows for moving the swath along the survey line. The slider can be dragged by the mouse, or when the graphic slider item is clicked, also the keyboard's arrow left and arrow right keys can be used for the navigation. The actual ping number in the box on the right hand side of the slider, shows the ping number in the brick cube. By clicking the small arrows to the right it is possible to change the view.
- Step: This is the step number for how many pings to jump when navigating the swath.
These options are interactive, so when changing the values the graphics will change immediately.
The Along part
- Along: The check box allows for showing the along line from the water column cube. This line will follow the navigation line for the survey line.
- Angle: The slider allows for dipping the along section from the vertical and to the outer angles of the brick cube. The slider can be dragged by the mouse, or when the graphic slider item is clicked, also the keyboard's arrow left and arrow right keys can be used for the navigation. When clicking the Reset button the section is moved back to the vertical.
- Size: This is the number of pings in the along section.
These options are interactive, so when changing the values the graphics will change immediately.
The Lock Camera part
- Lock Camera: The check box allows for locking the camera to a fixed position relative to the water column swath when moving the ping number slider.
When checked the graphic window will show the water column swath in the same position and all other data items will move. The opposite (default) is that all the other graphic items do not move when the ping number slider is moved, only the water column swath will move.
- Zoom: This is the slider tool controlling how much to zoom into the water column swath. Any zoom done by the mouse in the graphic window will be reset (ignored) when moving the slider.
- Elevation: This is the slider tool controlling how the elevation from the horizontal when looking at the water column swath. Any change of elevation done by the mouse in the graphic window will be reset (ignored) when moving the slider.
- Azimuth: This is the slider tool controlling how the horizontal direction from when looking at the water column swath. Any change of azimuth (rotation) done by the mouse in the graphic window will be reset (ignored) when moving the slider.
These options are interactive, so when changing the values the graphics will change immediately.
The Color Table part
This is where you select the color table which will be used when displaying the water column swath. The color tables available are the same as the color tables in the color table view in the toolbox.
This option is interactive, so when changing the values the graphics will change immediately.
The Color Range part
The color range is the controlling the minimum and maximum range for the colour table. The values in the water column data are within the range of -128 and 0.
- Min: The start value for the color table. Default is -128.
- Max: The stop value for the color table. Default is 0.
These options are interactive, so when changing the values the graphics will change immediately.
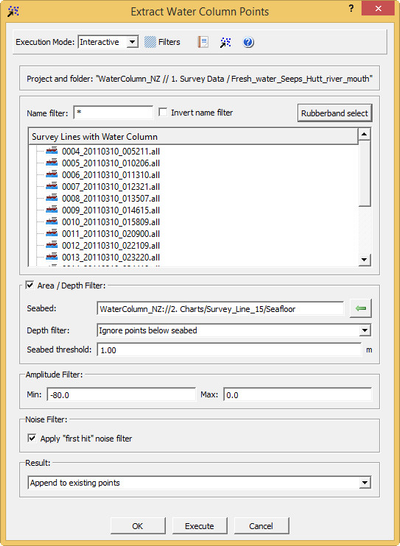
The Extract Water Column Points dialog
Extract Water Column Points
This command is executed from folders with schema type Multibeam and will extract the content of water column data (swath) as point cloud data sets. An area filter can be applied to extract data inside a specific geographic area only, and not for the whole survey line.
The content of the menu
The upper part of the menu shows the name of the project and folder the command is activated from.
The command's menu is split into five parts: Survey Lines with Water Column, Across/Depth Filter, Amplitude Filter, Noise Filter and Result.
After specifying the parameters, click the Execute button to extract the water column points data.
When the command is finished a report will be shown and saved in the Report folder in the Multibeam type folder.
In each of the survey lines from where water column points are extracted, a data item named Water Column Points will be created. The data type of this item is Pointcloud, and the maximum number of points in one item will be four million points. If more points are extracted into one survey line, a new data item is created.
The Survey Lines with Water Column part
- The list menu will show survey lines containing water column data.
- Several survey lines can be selected for extraction of points.
The Area / Depth Filter part
- Area / Depth Filter: The point extraction can filter away points that are not within a seabed grid, and points that are close to the seafloor. This is done when checking the Area / Depth filter.
- Seabed: You may select a grid dataset by clicking the dataset in the project, and then clicking the button with the green arrow. Only water column points located inside this grid will evaluated for extraction.
- Depth filter: The grid may be used to ignore water column points close to or below the seabed. If the seabed threshold has a positive value, points closer than the seabed threshold value above the seabed, and all points below will be ignored.
- Seabed threshold: The value of the threshold in the depth filter. Default value is 2.
The Amplitude Filter part
The amplitude filter is is the controlling the minimum and maximum range for the extracted water column points. The values in the water column data are within the range of -128 and 0. The filter will define how to remove most of the points with weak signals.
- Min: The weakest signal for the amplitude values. Default is -80.
- Max: The strongest signal for the amplitude values. Default is 0.
The Noise Filter part
- Apply first hit noise filter: The noise filter is applied to each water column slice before point extraction. The filter will decrease the signal in neighboring beams that appear when a beam has a detection. No parameters can be set to change the filter.
The Result part
This parameter decides the action if a survey line already has one or more Water Column Points data items:
- Replace existing points: All Water Column Points items in a survey line will be removed and replaced with the items created by the next run. This is the default value.
- Append to existing points: The next run will keep the current data and append new Water Column Points items in the survey line.
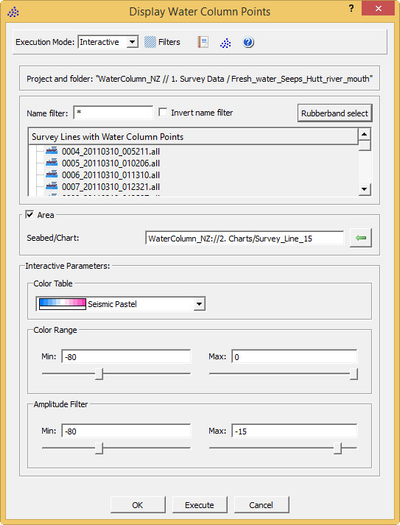
The Display Water Column Points dialog
Display Water Column Points
This command is executed from folders with schema type Multibeam and is used to display Water Column Points from the selected datasets.
The content of the menu
The upper part of the menu shows the name of the project and folder the command is activated from.
The command's menu is split into five parts: Survey Lines with Water Column, Area and Interactive Parameters.
After specifying the parameters, click the Execute button to display the water column points data.
The Survey Lines with Water Column Points part
This is a list of all survey lines which has Water Column Points. You should select the lines you want to display.
The Area part
The point display can filter away points that are not within an area of interest. You may select a Chart or dataset by clicking it in the project, and then clicking the button with the green arrow. Only water column points with a bounding box intersecting the Chart or Datasets bounding box will be displayed.
The Interactive Parameters part
The interactive parameters will update the graphics interactively after the first display. For the first display you need to click the execute button. In order to update the display according to the parameters that are not interactive, you also need to click the execute button.
- Color Table: This is where you select the color table which will be used when displaying the water column points. The color tables available are the same as the color tables in the color table view in the toolbox.
- Color Range: The colors in the selected color table will be applied to the amplitudes from the minimum value to the maximum value.
- Amplitude Filter: Only points within the minimum and maximum amplitude in the amplitude filter are displayed.