1. Seafloor Main Menu
- Tore Sannes (Unlicensed)
- Erlend Kvinnesland
- Harald Sund (Unlicensed)
In this section:
Introduction
The Seafloor Main Menu is a collection of commands and project properties in a Geocap Seafloor project. The most frequently used commands are accessible through this menu, which will make it easier for new users to operate the Seafloor user interface. However, these and more commands are also available from the project interface.
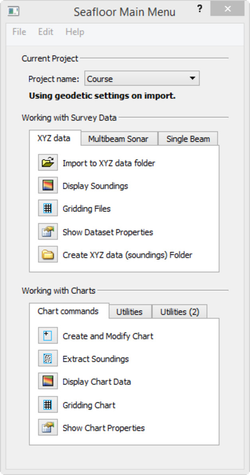
The Seafloor Main Menu.
How to open the Seafloor Main Menu
To open the Seafloor Main Menu it is required that the Seafloor package is loaded, and that requires that the license file contains one of the features for loading the package.
The Seafloor package is loaded either on startup of Geocap, or on the Tools menu, click the Options menu. In the menu that appears, click Plug-ins, and then select Seafloor in the right hand part of the menu.
When the Seafloor package is loaded, the menu bar in Geocap will contain a Seafloor pulldown menu.

The Seafloor pull down in the Geocap menu bar
On the Seafloor menu, click Seafloor Main Menu.
Open the menu
Then the Seafloor Main Menu is opened (see figure above).
For all actions in this menu it is required to load a project. If no project is loaded, the message "No project is currently loaded into Geocap!" will appear. Then a description on how to load a project follows.
The Content of the Seafloor Main Menu
The Seafloor Main Menu is divided in four parts, the menu bar, the Current project part, the Working with Survey Data part, and the Working with Charts part.
- The menu bar has three options: File, Edit, Help
- The Current project part contains information about which project is active, and what coordinate system the project is using.
- The Working with Survey Data part is the interface to useful commands for processing survey data through the Geocap Seafloor package.
- The Working with Charts part is the interface to useful commands for processing chart data through the Geocap Seafloor package.
Menu bar options (File, Edit, Help)
The upper part of the menu is a menu bar with the entries File, Edit and Help:
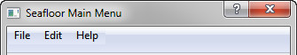
The Menu bar
For the actions from menu bar entries, see below.
File
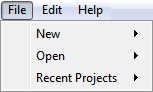
- New - Project... will open the dialog to make a new Geocap (Seafloor) project.
The dialog ends with a question about setting geodetic properties for the project. - New - Survey Data folder... will create a folder of type Survey from top level in the project.
- New - Charts Data folder... will create a folder of type Charts from top level in the project.
The last two commands are useful if the project does not have a folder of the actual type, or if a more than one folder of this type is required.
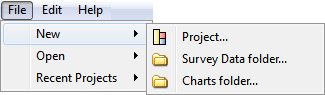
- Open - Project... will open any existing Geocap projects in the computer or network.
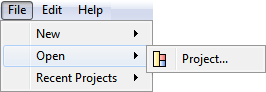
- Recent Projects will give a list of recently opened Geocap projects.
Edit
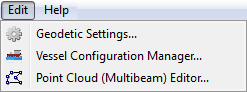
- Geodetic settings will open the dialog for setting geodetic properties for the project.
- Vessel Configuration Manager will open the dialog for setting vessel properties for all open projects. This entry will have a meaning only when Multibeam Sonar data are loaded.
- Point Cloud (Multibeam) Editor will open the 3D editing tool for point cloud data (multibeam data) (Multibeam Editor). This entry will work both when Point Cloud data and Multibeam Sonar data are loaded.
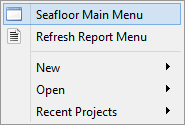
Help
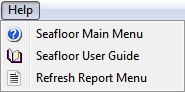
- Seafloor Main Menu will show the help dialog.
- Seafloor User Guide will open the Seafloor User Guide documentation as a pdf file.
- Refresh Report Menu will open the reports dialog containing the last processing results, if it is closed or hidden.
The Current Project part
The Current Project part shows the active project in the Seafloor Main Menu. In Geocap the user can load several projects at the time.
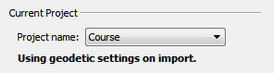
The Current Project part
All projects are shown in the pulldown menu behind the text Project Name. The pulldown and the the project information is is automatically updated if a project is closed or a new project loaded into Geocap.
The text Using geodetic settings on import indicates that during import of any dataset into Geocap, the data will be transformed to the project coordinate system. This action is set up in the Geodetic Settings menu.
To change the coordinate system, find the Edit menu, and click Geodetic Settings.
The text Not using geodetic settings on import indicates that a coordinate system is defined, but no transformation will be performed during import.
The text No geodetic settings is defined indicates that the project doe not have any coordinate system.
The Working with Survey Data part
The Working with Survey Data part
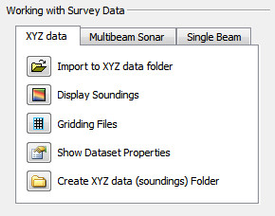
This part contains tabs for import, display and work with data typically from surveys. The three tabs are:
- The XYZ data tab
- The Multibeam Sonar tab
- The Single Beam tab
The available tabs will be dependent on the features in the license file. For Geocap Shelf users the tab menu will only have the XYZ data part.
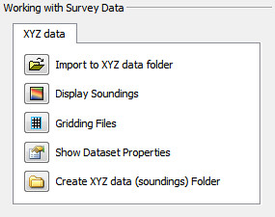
The tabs for Shelf
The XYZ data tab
The commands in the XYZ data tab are shortcuts to the commands on a folder of type Soundings. Many of the commands are Item Commands, which means that the settings in the menu is remembered for each folder.
If there are several folders of the same type in the project, a dialog will appear.
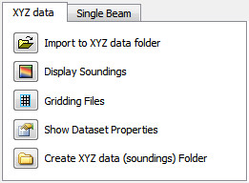
The XYZ data tab
Import to XYZ data folder: This command will import data to folders of type Soundings.
There is also a choice to use the Generic reader, the ASCII Column reader or the NaviModel DB reader.
Display Soundings: This command will display the data in folders of type Soundings.
Gridding Files: This command will make it possible to do gridding (terrain modelling) of the data in folders of type Soundings.
Show file properties: This command will show dataset name, bounding box and number of points of the data in folders of type Soundings.
Create XYZ data (soundings) Folder: This command will create a new folder of the type Soundings as a subfolder under a folder of type Survey.
The Multibeam Sonar tab
The commands in the Multibeam Sonar tab are shortcuts to the commands on a folder of type Multibeam. Many of the commands are Item Commands, which means that the settings in the menu is remembered for each folder.
If there are several folders of the same type in the project, a dialog will appear.
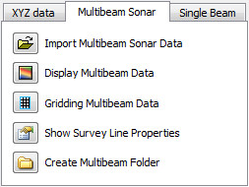
The Multibeam Sonar tab
Import Multibeam Sonar Data: This command will import data to folders of type Multibeam.
Display Multibeam Data: This command will display the data in folders of type Multibeam. Also data set name and navigation lines can be diplayed.
Gridding Multibeam Data: This command will make it possible to do gridding (terrain modelling) of the data in folders of type Multibeam.
Show Survey Line properties: This command will show dataset name, bounding box and number of points of the data in folders of type Multibeam.
Create Multibeam Folder: This command will create a new folder of the type Multibeam as a subfolder under a folder of type Survey.
The Single Beam tab
The commands in the Single Beam tab are shortcuts to the commands on a folder of type Single Beam. Many of the commands are Item Commands, which means that the settings in the menu is remembered for each folder.
If there are several folders of the same type in the project, a dialog will appear.
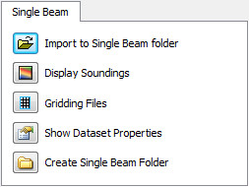
The Single Beam tab
Import to Single Beam folder: This command will import data to folders of type Single Beam.
There is also a choice to use the Generic reader or the ASCII Column reader.
Display Soundings: This command will display the data in folders of type Single Beam.
Gridding Files: This command will make it possible to do gridding (terrain modelling) of the data in folders of type Single Beam.
Show file properties: This command will show dataset name, bounding box and number of points of the data in folders of type Single Beam.
Create Single Beam Folder: This command will create a new folder of the type Single Beam as a subfolder under a folder of type Survey.
The Working with Charts part
The Working with Charts part
This part contains tabs for managing, display and work with data organized in charts (areas of interest). The three tabs are:
- The Chart commands tab
The Utilities tab
The Utilities (2) tab (Not enabled for Shelf)
The Chart commands tab
The commands in the Chart commands tab are shortcuts to the commands on folders of type Charts and on folders of type Chart. Many of the commands are Item Commands, which means that the settings in the menu is remembered for each folder.
If there are several folders of the same type in the project, a dialog will appear.
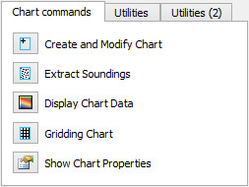
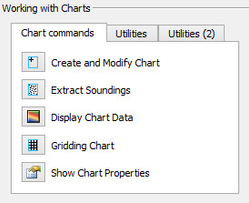
The Chart commands tab
Create and Modify Chart: This command will create or modify folders of type Chart.
Extract Soundings: This command will read data stored below a folder of type Survey, and save the result as a Soundings data set in folders of type Chart.
Display Chart Data: This command will display the different data stored in folders of type Chart. If there are several Charts folders in the project, a dialog will appear.
Gridding Chart: This command will work on folders of type Chart.
The command will read the Soundings dataset and create a digital terrain model (DTM). The result will be saved in the same folder as a Seafloor data set.
Show Chart properties: This command will show properties of the content of folders with type Chart.
The Utilities tab
This part contains buttons with commands for analysis of data in a Seafloor project. All commands work on folders on type Charts and on folders of type Chart.
All commands work on folders on type Charts and on folders of type Chart.
If there are several folders of the same type in the project, a dialog will appear.
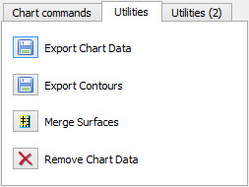
The Utilities tab
Export Chart Data: This command will export different type of data from folders of type Chart.
Typical datasets to export are Frame and Boundary polygons, Soundings (points) and Surface (DTM).
Export Contours: This command will export Contours data from the Seafloor (DTM) data set in folders of type Chart. An option is to export as Contour Areas instead.
Merge Surfaces: This command will create a new Seafloor surface (DTM) for a chart by merging surfaces from other charts in folders of type Chart.
Remove Chart Data: With this commands it is possible to remove specific data objects from folders of type Chart. The command can be specified to Remove entire chart folder and data, Remove specified chart folder item(s), or Remove empty chart.
The Utilities (2) tab
This part contains buttons with commands for analysis of data in a Seafloor project. All commands work on folders on type Charts and on folders of type Chart. This utility is not enabled for Shelf,
If there are several folders of the same type in the project, a dialog will appear.
.png?version=1&modificationDate=1433936070054&cacheVersion=1&api=v2&width=250&height=187)
The Utilities (2) tab
Make Outline and Holes: This command will create the outline (boundary) and interior hole polygons for a chart. The polygons can be created from the Seafloor (DTM) dataset or from the Soundings (points) dataset.
Make Profile: This command will create a continuous depth profile (intersection) through the Seafloor (DTM) data set in folders of type Chart.
Points Classification: This command will anaylyze the Seafloor (DTM) data set in folders of typeChart. The commands will create new points data sets of types Shoals, Deeps, Ridges, Saddles and Valleys.
Points Classification: This command will anaylyze the Seafloor (DTM) data set in folders of typeChart. The commands will create new points data sets of types Shoals, Deeps, Ridges, Saddles and Valleys.
Statistical Point Reduction: This command will reduce the amount of points from one or more input datasets. The selection method can for instance be priority of the Minimum orMaximum depth values. The selection area can be by looking at points inside a Rectangle or Circle. The selected points are always with the original position and not snapped into any grid structure.