A. Getting Started with Geocap Seafloor
- Tore Sannes (Unlicensed)
Introduction
Geocap is a software for mapping and modeling geoscientific data, designed with focus on interactivity and flexible control of visualization and manipulation. Geocap is operated through projects. The project "holds" the data in a folder-like structure, similar to Windows "File Explorer". All datasets are "children" of either a folder or another dataset. Geocap offers different project templates, giving you a pre-defined folder structure that fits your workflow for a specific type of work. In this tutorial collection we are going to use the Seafloor project template.
Data visualization and manipulation is operated through commands. Commands can be used to display datasets in the graphics window, manipulate existing datasets or to generate new datasets. The Geocap Sefloor module offers a range of commands for processing hydrographic data.These commands are available from the Seafloor Main Menu or if you right click a dataset or folder in the project.
All the project data is visualized in the graphics window and by using the mouse it is possible to pan, zoom, rotate, spin, scale z-axis and so on.
This section will guide you through the basics of opening a project, explore and display the project data and navigate in the graphics window.
Exercises
Starting Geocap
Start Geocap on Windows 7
On your start menu click Start > All programs > Geocap > Geocap 7.x.x - 64 > Geocap 7.x.x - 64
Start Geocap on Windows 8.1
- Go to the Start screen.
- Near the lower-left corner of the Start screen, click the arrow down and go to the Apps view.
- In the search field in the upper right corner, enter the text Geocap.
- All the files installed by the installation wizard will be listed. (It is also possible to find the Geocap 7.x.x group without using the search field.)
- Click on the Geocap 7.x.x - 64 entry to start the program.
-
User Documentation
Parts of the user documentation is found under the Help pulldown. There rest is found here: http://www.geocap.no/doc. Read briefly through the documentation to get an understanding of what you can expect to find in the documents.
The user documentations consists of:
- User Guide with detailed descriptions of Geocap usage.
- Reference manual with syntax and details of the commands in the Geocap scripting language.
- Installation Guide with details on installation, dongle drivers etc.
- Release Notes contains incremental updates and bug fix descriptions as well as major releases.
- Articles is a collection of articles on various topics that still is not included in the documentation.
- Tutorials contains thematic tutorials on products. The General tutorials mainly contains topics that are put in a better context within the more specialized product tutorials.
- FAQ is a list of Frequently asked questions, with their corresponding answers.
Initial Setup
Geocap comes with a range of settings which can modified to make it easier to work with. One of these settings is the working directory which is the folder Geocap will open every time you browse for something. We will now set this directory and we will also turn on auto save.
Set working directory and auto save
- Click Tools > Options
- Click the browse icon for the Working Directory.
- Select the folder Geocap1 and click Select folder
- Click on Projects
- Check the box Automatically save all projects at regular time intervals
- Set the Time interval to 5
- Click OK
-
Geocap Project
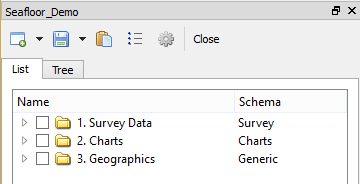
The Seafloor_Demo project is built using the Seafloor project template. This template consists of three main top level folders; 1. Survey Data, 2. Charts, 3. Geographics. The number ahead of the folder name is to have a logical sorting in the project tree. The Survey Data folder contains the imported data, like multibeam data, xyz points (soundings) or single beam data. Within the Charts folder the survey data can be extracted and processed within certian areas of interest. We are now going to open the Seafloor_Demo project and look closer at this project structure.
Open the Seafloor_Demo project
- Click File > Open > Project
- Browse to the location of the Seafloor_Demo project. (Geocap1/Projects/Seafloor_Demo/db)
- Select the Seafloor_Demo.db file and click Open. A window similar to the one below will appear.
An open project
Tip
Next time you can open the project by going to File > Recent Projects.
Pressing the small triangles (or '+' in other Windows versions) to the left of a folder will display the folder's contents. Datasets and folders are organized very similarly to a file tree structure. A folder can contain datasets or other folders.
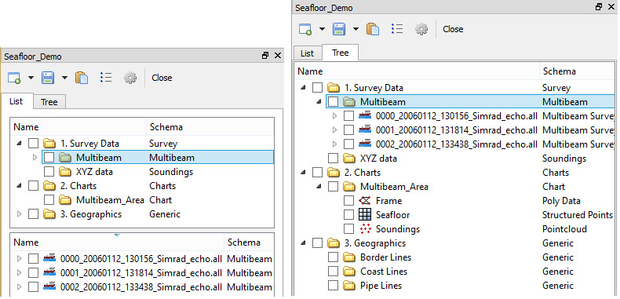
The Geocap Project structure and data items shown in List Mode (left) and in Tree mode (right).
In the next exercise we are going to explore how the Seafloor project is structured. Taking notice of how folders and datasets are organized. Datasets and folders can be cut, copied, pasted, renamed and deleted. This is performed from the popup menu which appears when right-clicking a dataset. The right click popup menu also contains commands which may be executed on the datasets.
Explore the project folder structure
- Expand the different folders and observe the sub folders and datasets
- Right click on folders and datasets and look at the right-click menus.
Note that there are two "modes" of the project view. Switch between these two by clicking on the tabs; List and Tree. List view sorts folder content into a separate window, while Tree view sorts everything into the tree itself.
A Geocap project is stored in a folder on your computer. The project consist of a ".db" file, which contains information about the project tree, and several files which contain the data sets. You should let Geocap manage the files in the project folder and should not store other files in this folder.
If you want to make a backup of your projects, or if you want to exchange Geocap projects with other Geocap users you may zip the project folder with all the underlaying datasets into one file. This is convenient for sending e.g. to support@geocap.no.
-
Displaying Data
By right clicking a dataset a range of different visualization commands is made available. For each type of dataset Geocap will have a default command. This is the command which will be used when ticking the checkbox next to a dataset. We are now going to display the different datasets in the project using the default command.
Display data
Display the various datasets in the project
- Locate a grid dataset (structured points) e.g. 2. Charts/Multibeam_Area/Seafloor
- Right click the dataset and select Zoom to Data. This will make the display window center the graphics window around the dataset.
- Right click the dataset again and try a display command e.g. Display, Map Data, Lod Grid Display.
- Display some of the lines (Boundary and Frame) under the Multibeam_Area charts by right-clicking and selecting the command Display.
- Check, and uncheck the checkboxes to the left of the displayed items and observe that this toggles displayed objects on/off. You can also check and uncheck the folders containing displayed items.
- Items can also be displayed double clicking on one of the commands in the Toolbox (Item, Schema and Shared commands)
Note that by checking and unchecking the upper level folder 2. Charts, or Multibeam_Area all datasets displayed under this folder are shown and hidden.
-
Navigating in the 3D window
Now that we have displayed some of our data we can start navigating around the Atlantis continental shelf. Geocap is best operated using a three-button mouse with a wheel, see picture below. A two-button mouse or using the Touch-pad is possible but not recommended. Navigating in the 3D graphics window is done by pressing one of the mouse buttons while the cursor is in the graphics window, and moving the mouse while keeping the button pressed.
- Rotate - Press left mouse button + move
- Pan - Press middle mouse button (wheel) + move or Shift + left mouse button + move
- Zoom - Press right mouse button + move
- Scale Z - Scroll mouse wheel
- Spin - Ctrl + press left mouse button + move
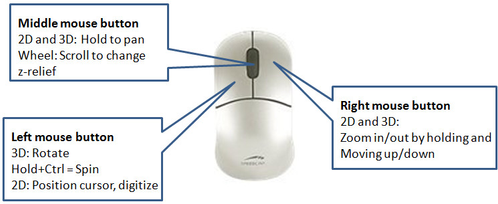
The mouse buttons
Navigate using the mouse
- Zoom in close to one of the bathymetric profiles displayed by press right mouse button and moving the mouse upwards.
- Pan along the seabed surface by pressing the middle mouse button (wheel) and moving the mouse in any direction.
- Zoom out again by press right mouse button and moving the mouse downwards.
- Rotate the displayed data by pressing the left mouse button and moving the mouse.
- Spin the data by holding down Ctrl on your keyboard, pressing the left mouse button and moving the mouse.
- Now try to increase the z-scale by scrolling the mouse wheel upwards.
Move around the 3D model an practice these elements for a few minutes.
Tip
The focal point is the center of the display and the point of rotation. Change the focal point by positioning the mouse cursor on a desired point in the display window and press the X key on the keyboard.