G. Charts
- Erlend Kvinnesland
- Tore Sannes (Unlicensed)
- Harald Sund (Unlicensed)
Introduction
Working with large amounts of data can be cumbersome. Thus, Seafloor lets you divide your survey area into smaller areas called charts. These charts are populated with multibeam soundings and you can then perform operations like gridding and points classification on each chart.
The Chart operations are commands executed on folders of schema type Chart, located on folders of schema type Charts.
The Charts folder contains several menu items on the right click menu. The tools for charts are located in the upper part of the menu and listed in the graphic below.
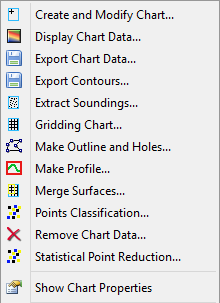
The Charts folder menu
In this excercise we will look at how to create, display and modify charts.
Exercises
-
Create a single chart from the Multibeam data
Create a single chart from the Multibeam data
- Click the Chart commands tab in the Seafloor Main Menu.
- Click the Create and Modify Chart button.
- In the Create Single Chart tab, type MainChart as Chart name.
- In the Create Single Chart tab click Scale to Survey Data.
- In the dialog that pops up, tick the Multibeam folder checkbox and click OK. The menu should now look similar to the one below:
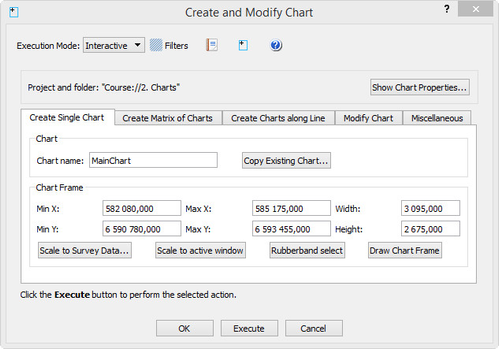
- Click Execute to create the chart and click OK in the dialog that pops up.
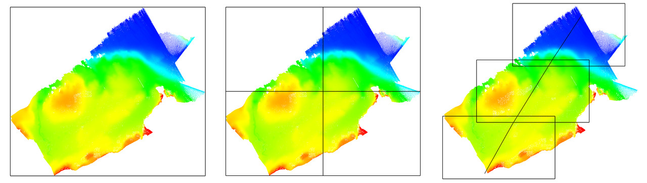
Example of chart frame types: Single Chart, Matrix of Charts and Charts along Line.
-
Create a single chart from the XYZ data
Create a single chart from the XYZ data
- In the Create Single Chart type in XYZ_data as Chart name.
- In the Create Single Chart tab click Scale to Survey Data.
- In the dialog that pops up, tick the XYZ data folder checkbox and click OK. The menu should now look similar to the one below:
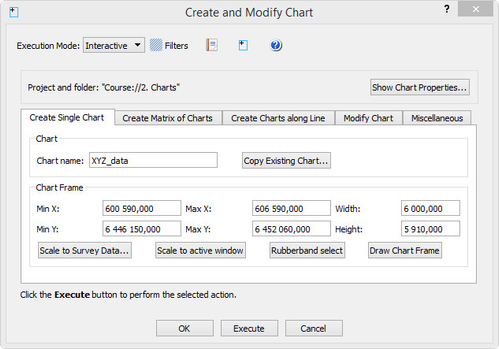
- Click Execute to create the chart and click OK in the dialog that pops up.
It is also possible to create charts by the methods:
- Get coordinates from the active window (Scale to active window).
- Specifying lower left and upper right coordinates.
- Specifying lower left corner coordinates, width and height.
- Drawing a rectangle in the graphics window (Rubberband select).
- Create Matrix of Charts.
- Create Charts along a line.
-
Create a matrix of charts
We will now use the MainChart as a master chart for the whole area of your multibeam survey. We are now going to create sub-charts from this chart.
The amount of points we work with in this section is not very huge, so for this amount of data we would not made the matrix of charts. We will recommend this method when the amount of points in the project is several hundreds of million, also dependent on the Geocap version (32 bit or 64 bit) and the computer's memory configuration.
Create sub-charts as matrix of charts
- Click the Create Matrix of Charts tab.
- Make sure that your MainChart has been selected in the Master Chart section of the menu.
- Keep the name SubChart- with extension set to Automatic. This will give the chart name SubChart-1 and so on.
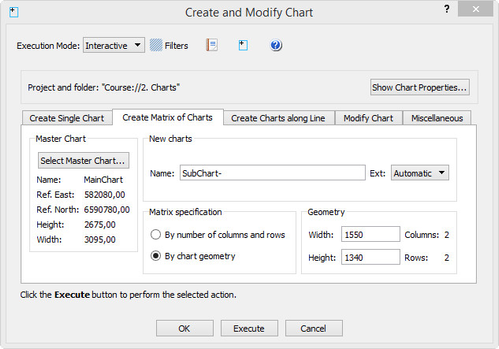
- Note that the Matrix specification is By number of columns and rows has been selected with number of Columns and Rows set to 2, the corresponding Width is 1547,50 and the Height is 1337,50.
- To have nicer chart sizes change the Matrix specification to By chart geometry, and set the Width to 1550 and Height to 1340. Note that the number of Rows and Columns of charts automatically will change when you change the height and width.
- The menu should now look similar to the image below:
- Click Execute
- You will be asked if you want to create 4 (2x2) charts. Click Yes
- Click OK in the dialog that pops up.
- Click OK on the Create and Modify Chart menu
You now have one MainChart folder, one XYZ_data folder and four SubChart-x folders inside the 2. Charts folder.
-
Populate charts with data
After the you have created the charts the folders will only contain a frame, thus we need to extract the multibeam soundings and populate them into the frames.
Populate charts with data
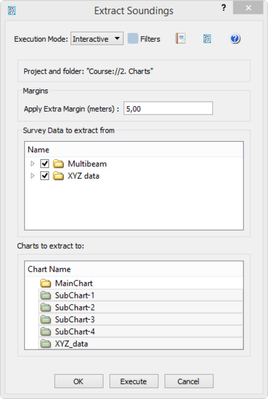
- Click Extract Soundings on the Chart commands tab in the Seafloor Main Menu.
- In Margins type in 5 m to avoid any loss of data between the charts. (Dependent on the gridding increments.)
- Tick both the Multibeam checkbox and the XYZ data checkbox.
- Select all the SubChart-x in the Chart Name section. Also select the XYZ_data chart.
- Click Execute and the extraction process will start.
- Click OK in the dialog the pops up.
- Click OK on the Extract Soundings menu.
Each sub-chart will now contain a dataset named Soundings in addition to the Frame dataset.
-
Chart properties
Show properties for each chart
- Click Show Chart Properties on the Chart commands tab in the Seafloor Main Menu.
Observe that the list contains one row for each chart. Take a closer look at the different columns.
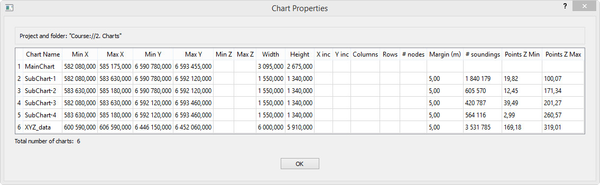
Showing Chart Properties
Display chart data
Display chart frames
- Click Display Chart Data on the Chart commands tab in the Seafloor Main Menu.
- Make sure that only Frame is checked in Select Data Object.
- Select all the SubCharts-x.
- Make sure that Scale to selected charts is checked.
- Click Execute.
- Check the Chart Name box to see the name of the charts.
Display chart soundings
- Open the Display Chart Data menu again.
- Check the following boxes; Frame, Soundings, Use colour range, Use same range for all and Use LOD.
- Select all the SubCharts-x.
- Click Execute.
-
Modify chart
The Modify Chart tab can be used to rename the chart or change the definitions of the chart frame.
How to modify chart definitions
- Click the Chart commands tab in the Seafloor Main Menu.
- Click the Create and Modify Chart button.
- Open the Modify Chart tab and look at the content.
- Click the Chart to modify button and select the XYZ_data chart.
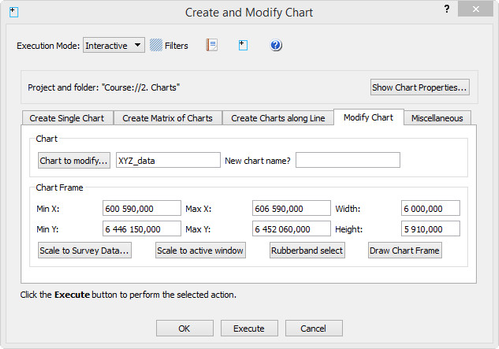
- In the Chart Frame part, change the Height from 5910 to 5900 (meters).
- Click Execute.
- Click Yes on Do you really want to modify chart "XYZ_data"? and OK in the information box which appears next.
- Click the Show Chart Properties button up to the right for all the tabs to verify the changes.
When the chart frame is changed it can be necessary to repeat the Extract Soundings operation. In the example above the change is so small that we do not want perform a new extraction of points. We have also made the area smaller so we will not need to get more points for filling into the chart frame.
If we had been through the gridding of the chart we should consider to redo the gridding operation within the new chart frame.
-
Manipulate charts in the Miscellaneous tab
In the Miscellaneous tab there are som additional tools for the charts:
- Rename charts: Will rename the selected charts (chart series) to new charts series name and number.
- Export chart definitions: The chart names and chart extensions (frame) can be exported to an ascii file.
- Import chart definitions: The chart names and chart extensions can be imported from an ascii file.
- Delete charts: The selected chart(s) will be removed from the project.
How to remove a chart with the Create and Modify Charts tool
- Click the Chart commands tab in the Seafloor Main Menu.
- Click the Create and Modify Chart button.
- Open the Miscellaneous tab and look at the content.
- In the Mode part, select the Delete charts option.
- In the Chart Name list, select the XYZ_data chart:
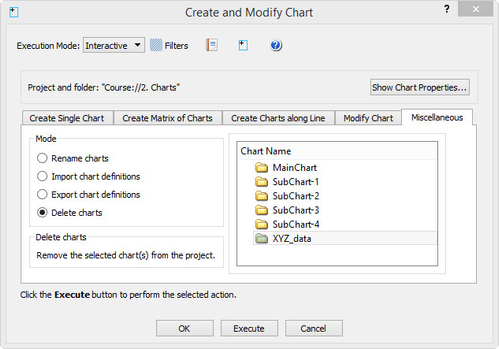
- Click Execute.
- Click Yes on Do you want to delete 1 chart? and OK in the information box which appears next.
- Notice that the Chart Name list is updated and the XYZ_data chart has disappeared.
The command Remove Chart Data have some other options for the charts. The command can remove specific chart items like Boundary, Holes, Seafloor, Soundings etc.
The command can also remove Empty charts, i.e. charts which are missing Soundings after Extract Soundings.
The command can also remove the entire chart(s), like the Delete charts option described in the exercise above.
It is also possible to remove charts simply by deleting the chart's folder from the 2. Charts main folder.