Q. Statistical Point Reduction
- Tore Sannes (Unlicensed)
Introduction
This command will reduce the amount of points from one or more input data sets. The selection method can for instance be priority of the Minimum or Maximum depth values. The selection area can be by looking at points inside a Rectangle or Circle. The selected points are always with the original position and not snapped into any grid structure.
The output will be a new point data set which in Geocap will have a schema of type Pointcloud. The command is a folder command and is implemented for folders with schema types Charts, Multibeam, Soundings and Generic.
Seafloor can select the points within the following categories:
- Minimum
- Maximum
- Shallower than Mean
- Deeper than Mean
- Closest to Mean
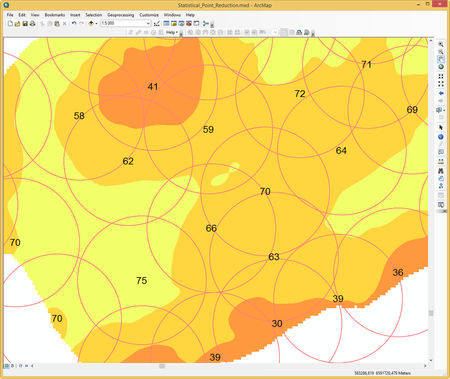
Selection of shallowest point within 250 m radii.
This exercise expects that the project already contains at least one chart and a corresponding Seafloor surface.
Exercises
Select points within Circle
- On the Utilities (2) tab in the Seafloor Main Menu, click Statistical Point Reduction.
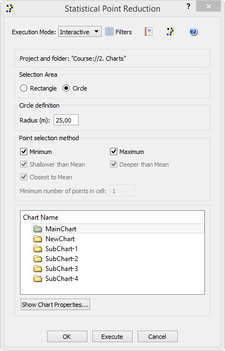
- Check the selection area Circle.
- Set radius 25 meters.
- Check the Point selection methods Minimum and Maximum.
- Note that the uncheckable boxes are for the Rectangle selection area.
- Select the main chart.
- Click Execute.
The resulting datasets can be found in the specified chart folder a with the name Soundings_<method>_Radius_<radius>.
Display selected points
- Browse to the folder for the actual chart.
- Display the dataset Soundings_Minimum_Values_Radius_25 by right click and select LOD Points Display.
- Display the dataset Soundings_Maximum_Values_Radius_25 by right click and select LOD Points Display.
Repeat the last excercise by changing the radius. Also try to run the command with the selection area Rectangle.