H. Gridding Files and Charts
- Erlend Kvinnesland
- Tore Sannes (Unlicensed)
- Harald Sund (Unlicensed)
Owned by Erlend Kvinnesland
Last updated: Nov 30, 2015 by Tore Sannes (Unlicensed)
Introduction
Gridding can be performed directly on processed multibeam data or on separate charts. Seafloor offers several gridding algorithms, filtering and smoothing. Filtered points can be saved in the project.
Exercises
-
Gridding Multibeam Data
Exercise
Gridding multibeam data
- Right click the Multibeam folder under 1.Survey Data, select Gridding Multibeam Data... and the gridding menu will pop up.
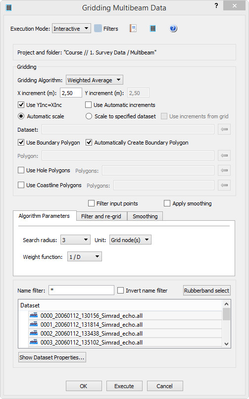
Multibeam gridding menu - Keep Weighted Average as the gridding algorithm.
- Change X increment to 2.5 and keep the Use YInc=XInc option.
- In the Algorithm Parameters tab set Search radius to 5 and verify that the Unit is set to Grid node(s).
- Keep the Weight function as 1/D.
- Select all the survey lines (click one and use ctrl + a).
- Click Execute and the gridding process will start.
- When the gridding has finished a report window will pop up, showing the details of the gridding process
- Click OK.
The grid is saved as Surface_WeightedAverage in the 1. Survey Data / Multibeam folder.
Exercise
Displaying the result grid
- Right-click the Surface_WeightedAverage grid in the 1. Survey Data / Multibeam folder and select Zoom to Data.
- Right-click the Surface_WeightedAverage grid again and select LOD Grid Display.
-
Gridding data in Charts
Exercise
Gridding charts
- Select the Chart commands tab in the Seafloor Main Menu.
- Click Gridding Chart.
- Keep Weighted Average as the gridding algorithm.
- Change X increment to 2.5 and keep the Use YInc=XInc option.
- In the Algorithm Parameters tab set Search radius to 5 and verify that the Unit is set to Grid node(s).
- Keep the Weight function as 1/D.
- Check the Filter input points box.
- Click the Filter and re-grid tab.
- Check the Save filtered points box, set Filter type to Standard deviation and set Shallow factor and Deep factor to 3.
- Select all the SubChart-x (click first and use shift + click on last).
- Click Execute and the gridding process will start.
When the gridding has finished, each sub chart folder will have three new datasets: Seafloor, Soundings_Accepted and Soundings_Rejected.
Exercise
Display Chart grids
- In the Chart commands tab in the Seafloor Main Menu, click Display Chart Data.
- Make sure Frame box is checked.
- Check the Seafloor box and make sure Use same range for all and Use LOD is checked.
- Make sure the Scale to selected charts is checked.
- Select all the SubChart-x (click first and use shift + click on last).
- Click Execute.
Exercise
Display rejected soundings
- Click the X icon on the main toolbar to remove all graphics.
- Go to the folder SubChart-1 in the project.
- Right click the Seafloor dataset and select Zoom to Data.
- Right click the Seafloor dataset again and select LOD Grid Display.
- Right click Sounding_Rejected and select LOD Points Display.
You will now see the points that were filtered away with the standard deviation filter during the gridding process.
Exercise
Merge Chart surfaces
- Right-click the 2. Charts folder and select Merge Surfaces.
- Click the browse button and select the 2. Charts / MainChart folder to save the merged surface in.
- Keep the default option for Specify surface increments (Use increments from first grid).
- Select all the subcharts and move them over to the right column by clicing the >> button. The menu should now look like the image below:
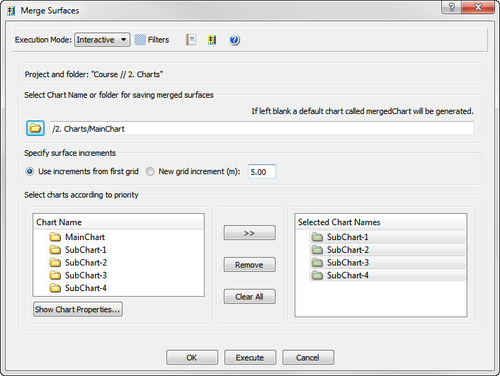
- Click Execute and a dialog will pop up asking if you want to merge 4 charts.
- Click Yes.
A report window will pop up when the merging has been performed. The merged surface will be saved in the 2. Charts / MainChart folder.
, multiple selections available,