E. Display Data
- Erlend Kvinnesland
- Tore Sannes (Unlicensed)
- Harald Sund (Unlicensed)
Introduction
There are several ways to display multibeam soundings and XYZ data. XYZ datasets has the following display commands available on their right-click menu;
- Display
- Display Points
- LOD Points Display
- Map Data
Multibeam Survey files has the following display commands available on their right click menu;
- Display
- LOD Points Display
- Map Depth
- Map Amplitude
In many cases you want to display several datasets together, showing the same range for all the files. The Display Soundings and Display Multibeam Data commands in the Seafloor Main Menu offers an easy interface for displaying data objects together in different ways. These commands are also available on the right-click on the XYZ data folder and Multibeam folder respectively.
Level Of Detail (LOD) displays points and grids based on the current zoom level. This means that the resolution increases automatically when you zoom closer, which makes the display of large point clouds or grid a lot faster.
Exercises
-
XYZ Data
Display XYZ data (Soundings)
- Select the XYZ data tab on the Seafloor Main Menu.
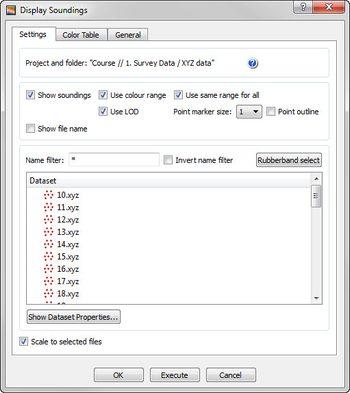
- Click Display Soundings.
In the list of datasets, select the XYZ datasets you want to display and make sure the settings are equal to the image below.
- Click Execute.
You should now be able to see the soundings in the graphics window.
Displaying XYZ data
Selecting datasets works the same way as in a Windows file browser, which means you can hold down shift or ctrl to select several datasets, or use ctrl + a to select all.
-
Multibeam Data
Display Multibeam data
- Select the Multibeam Sonar tab on the Seafloor Main Menu.
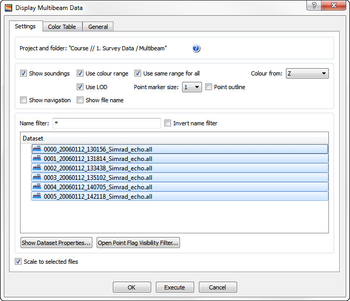
- Click Display Multibeam Data.
- Select the Survey Lines you want to display and make sure the settings are equal to the image below.
- Click Execute.
You should now be able to see the soundings in the graphics window.
Displaying multibeam data
Experiment with different display settings
Make sure the Display Mulitibeam Data menu is open and that all survey lines has been selected.
Try this:
- Un-check Use color range and click Execute - Observe that the soundings from each survey line will have different colors.
- Set the Point marker size to 5 and click Execute - Observe that the points size increased.
- Check the Show navigation box and click Execute - Observe that the navigation line is now displayed.
- Check the Use color range box again and go to the Color Table tab.
- Check the Use Color Table box, select Absolute range and type in the values 50 and 200.
- Click Execute and observe that the mapping range is between 50m and 200m.
Display filtered data
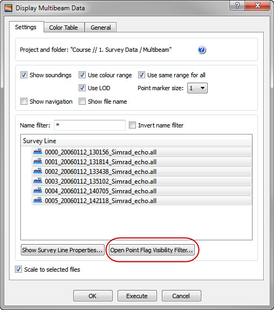
Make sure the Display Mulitibeam Data menu is open and that all survey lines has been displayed.
- Click on the Open Point Flag Visibility Filter button.
- Notice that the flag All points has been checked as Normal and that the flag Deleted has been checked as Hide.
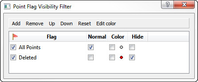
- Check the Color box for the Deleted flag.
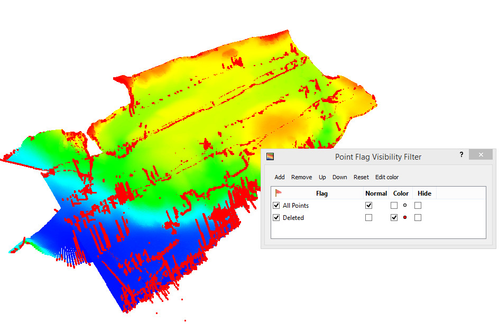
The red points that are now displayed are points that were filtered away during import. This could be because of missing navigation or that they were flagged as not valid by the multibeam echosounder.