D. Import Data
- Erlend Kvinnesland
- Tore Sannes (Unlicensed)
- Harald Sund (Unlicensed)
Introduction
Geocap supports a vast amount of Multibeam Sonar Data, in addition to Single Beam and XYZ data. These types of datasets are imported in different folders in the 1. Survey Data folder.
Geocap also supports import of sensor files in ASCII format, like Tide, Navigation, Velocity, Gyro, Heave, Roll and Pitch.
Exercises
Importing
Import XYZ data
- Click the XYZ data tab in the Seafloor Main Menu.
- Click Import to XYZ data folder.
- Click Generic reader.
- Click the browse icon and browse to the folder ..\Seafloor_Course\XYZ\Simrad_xyz on disk.
- Select all files and click Open.
- Observe that the File header/information looks ok.
- Keep the Schema as is.
- Click Execute and the import will start.
- After import a dialog will pop up, with information about the import. Click OK on this.
You should now be able to see your xyz data files in the project folder 1. Survey Data / XYZ data.
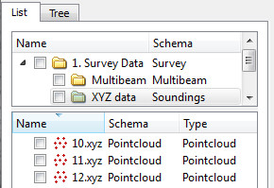
Imported XYZ files
Import Multibeam Sonar data
- Click the Multibeam Sonar tab in the Seafloor Main Menu.
- Click Import Multibeam Sonar Data.
- Click the browse icon and browse to the folder ..\Seafloor_Course\Multibeam Sensor Data\EM_710 on disk.
- Select all files and click Open.
- Keep the Import Options as is.
- Click Execute and the import will start.
- After import a dialog will pop up, with information about the import. This report will also be available in the folder 1. Survey Data / Multibeam /Reports.
You should now be able to see your multibeam files in the project folder 1. Survey Data / Multibeam.
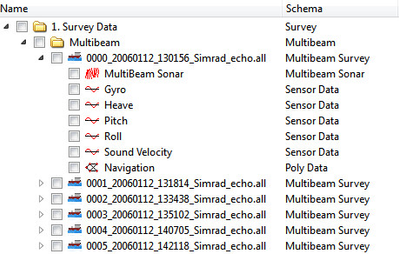
Imported Multibeam Sonar data
Read more about the import options by clicking the ? icon on the import menu.
The different import commands are also available on the right-click menus of the Multibeam folder and XYZ data folder.
-
Data properties
After importing it might be valuable to take a look at the properties for the files you just imported, to check the range, number of points etc.
Show properties for the Multibeam data
- Click the Multibeam Sonar tab in the Seafloor Main Menu.
- Click Show Survey Line Properties. A window containing the properties will pop up.
Observe that the list contains a row for each file, with X-, Y-, Z-range and number of points. At the bottom of the window you will see the total range and number of points for all files.
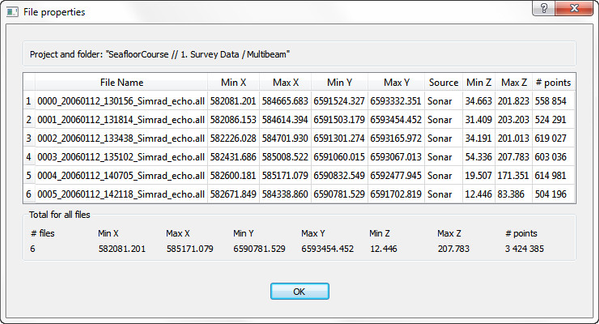
Showing Survey Line Properties
You can copy these properties straight into e.g. Excel. Just select a row, column or the whole table (Ctrl+A), press Ctrl+C on your keyboard and then Ctrl+V in Excel.
Show properties for the XYZ data
- Click the XYZ data tab in the Seafloor Main Menu.
- Click Show Dataset Properties. A window containing the properties will pop up.
Observe that the list contains a row for each file, with X-, Y-, Z-range and number of points. At the bottom of the window you will see the total range and number of points for all files.
These commands are also available on the Multibeam and XYZ data folders in the project. You can also display the properties from within different command menus, i.e. Display Multibeam Data.