O. Chart Utilities
- Tore Sannes (Unlicensed)
Introduction
In Seafloor there is a lot of functionality to create more results and analysis. Some of the functionality mentioned in this section is started from the Seafloor Main Menu, or from the Charts folder, or from a specific data type, like Structured Points.
Exercises
Make Outline and Holes
This command will create outline polygons (boundary ) and/or interior holes from either points or surfaces in the selected chart(s). The command has options to make the polygons from Soundings or Seafloor data objects in the charts.
Make Outline and Holes
- In the Utilities (2) tab in the Seafloor Main Menu, click Make Outline and Holes.
- Inside the frame named "Make polygons from", click the option Seafloor.
- Check the box ahead of Outline, and use the option Keep all outline polygons.
- Check the box ahead of Holes, and use the option Keep all holes polygons.
- In the Chart Name part, select the MainChart (or another chart).
- Click Execute.
- Verify the new data sets Boundary and Holes in the chart folder.
Repeat the exercise by trying the option Remove small outline poygons and turning off the option to make the Holes polygons.
Also make the outline from the Soundings dataset.
The command can also be executed from any folder of type Generic, Soundings, Single Beam or Multibeam. Select either Points or Surface to make polygons from. The command will not merge the input data but process each input dataset individually.
The command can also be executed from any Structured Points or Poly Data/Pointcloud dataset.
-
Digitizing
Digitizing is one of the most important ways the user can interact with Geocap to create new dataset. In contrast to typing in numbers in an editor, the digitizer gives the user the ability to interact with graphically displayed data.
Quick digitizing
- Make sure you have displayed all relevant data before you start the digitizing. Also check if the graphics window is in 2D mode.
- The Quick digitizer is started from Tools > Quick Digitizing.
- Check the box ahead of Use rubber line in the lower part of the menu. The rubber line can be turned on and off during the digitizing by pressing the b key on the keyboard.
- Click Start digitizing and use the left mouse button to digitize.
- Click Connect to start if you want to close the polygon, or press the h key (=home) on the keyboard.
- To start a new line segment, press the f key (=insert flag) on the keyboard.
- Click Stop digitizing to save the line/polygon.
- The digitized_line is now in the workspace. To save the data set in the project, select a folder and right click and select New > Workspace Data > digitized_line.
A digitized line is saved in the workspace by default. Use the Save digitized line also in folder option to save it directly in the project. Just tick the check box and browse in the folder you would like to save it to.
-
Make Profile
This command will extract continuous profile data based on a line crossing the selected chart(s). The command has two options, make one Along profile or multiple Across profiles. The profiles will be seamless over the edges of the input charts.
Make Profile
- First use the Quick Digitizer to create a profile line over the actual surface(s). It is also possible to import an existing line from a disk file.
- In the Utilities (2) tab in the Seafloor Main Menu, click Make Profile.
- In the project folder, locate the profile line (for example digitized_line). Then, in the Profile Data part, click the green arrow to the left of the text field to select the line.
- Select the Mode Along Profile. and set the parameters Point spacing (m) to 1,00 and Start value (m) to 0,00.
- Select all the sub-charts. in the Chart Name part.
- Click Execute
- This will create the dataset digitized_line_alongProfile in the same folder as the XY profile is located.
- Change the mode to Across Profiles. Set the parameters Profile spacing (m) to 10,00, Profile length (m) to 50,00, Point spacing (m) to 1,00, and Start value (m) to 0,00.
- When clicking Execute the dataset digitized_line_acrossProfile.
- Display both lines in the 3D window.
- Also open the Table View for each of the new datasets to look at the data.
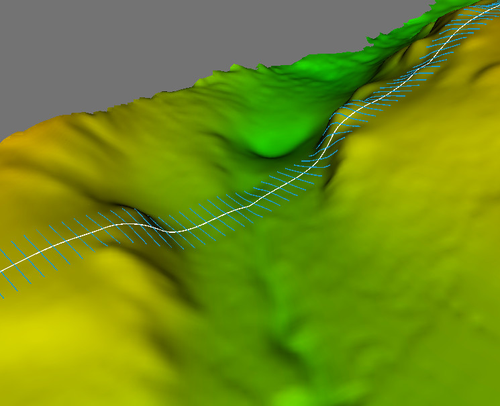
Along and Across profiles shown on the surface.