/
How to make charts in ArcMap
How to make charts in ArcMap
- Tore Sannes (Unlicensed)
Owned by Tore Sannes (Unlicensed)
Last updated: Mar 30, 2015
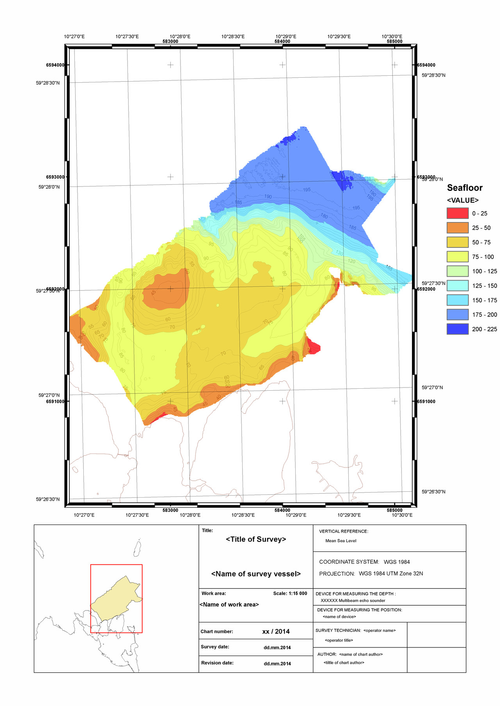
This document is a description on how to print maps or charts in ArcMap Basic. The examples are typical data exported from Geocap Seafloor. This document is not meant to replace any training courses in using ArcMap. The intention is to have a short guide on how to create map layouts, import data and define the symbology (graphic attributes) for rasters, points, lines and polygons. Additional knowledge about using ArcMap is recommended. Some of the texts and images in this document are ArcGIS Desktop 10.3 Help texts. Introduction
, multiple selections available,
Related content
3. Create and modify charts
3. Create and modify charts
More like this
Export Chart data
Export Chart data
More like this
O. Chart Utilities
O. Chart Utilities
More like this
8. Charts
8. Charts
More like this
Adding layers to a map (in ArcMap)
Adding layers to a map (in ArcMap)
More like this