Extracting seismic data
Introduction
The Geocap Seismic Explorer lets you extract data from seismic 3D cubes. Examples of such data are:
- Vertical non-planar sections that follow an arbitrary path through the cube. These are called arbitrary lines.
- Single planar sections like an inline, crossline or timeslice.
Extracting arbitrary lines
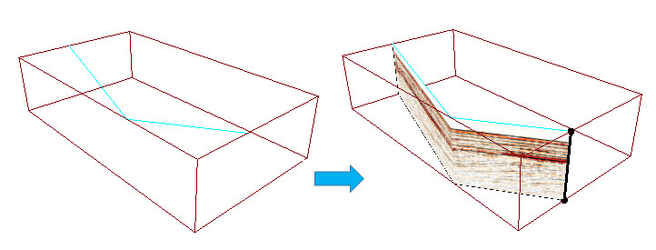
An arbitrary line is a vertical segment of the seismic data that cuts in an arbitrary manner through the cube. The extraction is performed by intersecting the seismic cube with a geometric feature, typically a well. The intersecting geometry need not be immersed in the cube; it's valid even if it is just a flat line positioned somewhere within the XY extent of the cube. It needs to have an extent in the XY plane, though. Intersecting the cube with a strictly vertical line will not work.
The extraction process will result in two different datasets being created.
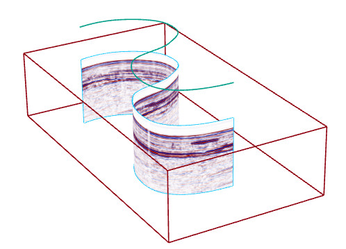
- A raster containing the seismic line.
- A feature containing the geometry for the outline boundary of the seismic line raster.
The above figure shows the intersecting geometry (green) and the raster outline (blue). The georeferencing will be assigned to the seismic outline feature, not the seismic raster. The raster is simply rendered inside the spatially positioned outline.
To extract an arbitrary line:
- Open the tool Extract Seismic Line
- In the field Seismic Cubes Feature Class select the feature class containing the 3D survey that you wish to operate on.
- The entry Seismic Survey will list the available surveys. Choose the one from which you want to extract data.
- The entries Top Z Values and Bottom Z Values lets you restrict the cubes z range involved in the extraction . This will speed up the processing and lead to smaller result datasets.
- For the entry Intersecting Geometry Feature Class choose the feature class containing the intersecting geometry.
- In the field Intersecting Feature choose the feature containing the intersecting geometry.
- In the field Output Raster enter the name and location of the resulting raster containing the data extracted from the seismics. This path must include the name of the raster. The raster can be stored either in a geodatabase or as a file. If you choose a file you should include a valid extension like 'tif' or 'png. This path will be stored as an attribute of the outline feature created during the extraction . You can enter a raster path relative to the geodatabase containing the raster outline feature, see the description for the Raster outline location further down. Following are some examples of raster paths:
- c:/mygeodatabase.gdb/myraster
- myrasters/my_relative_raster.png
- In the field Pixel Format you have the following choices:
- Choose 32 bit float to create a single-band raster containing the original seismic amplitudes. These values do not in themselves represent a color, but will be mapped to a color ramp during display.This option thas the advantage of retaining the original data values.
- RGB raster. Here the seismic amplitudes will be mapped to colors and converted to RGB values.
- Raster outline location. Here you will choose the location of the feature class containing the raster outline.
- In the field Raster Outline Name choose the name of the raster outline feature class.
- Choose the level of resampling in the field Resampling Factor. During the intersection and extraction process the seismic amplitudes will be interpolated along the intersecting geometry. Choose 5 for maximum interpolation. This will give the highest quality result but will also increase the processing time and raster size.
- In the Color Ramp field select the name of the color ramp that you wish to use for color mapping. You may optionally reverse the colors.
- In the fields Stretch along color ramp choose the minimum and maximum data range for which the color ramp will apply. This will ensure that the colors span a data range of interest without including noise etc.
- Click OK to begin execution.
See the section Visualizing extracted seismics to learn how to visualize the extracted seismics.
Extracting seismic sections
You can use the tool Extract Seismic Section to extract a spesific inline, crossline, or timeslice from a seismic cube.
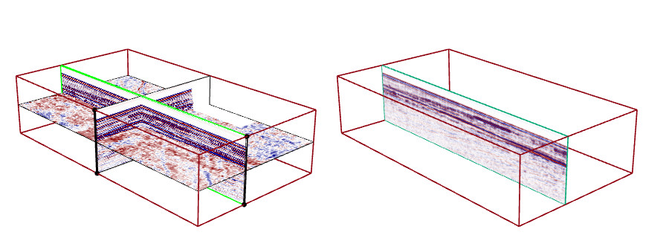
The above figure show a particular crossline extracted from a seismic cube. The crossline will be stored as a rasterfile or in a geodatabase. Associated with the extracted section is the geometric feature containing the raster outline. They are both created during the extraction process.
To extract a section:
- Open the tool Extract Seismic Section
- Select the feature class that contains your seismic survey from which you wish to extract data. This must be a feature class containing 3D surveys.
- Select the particular survey containing the data that you wish to extract
- In the field Type of Section choose inline, crossline or timeslice.
- In the field Output Raster select the location and name of the output raster. This location can be a file on disk or a raster in a geodatabase. If you choose a file you should include a valid extension like 'tif' or 'png. This path will be stored as an attribute of the outline feature created during the extraction . You can enter a raster path relative to the geodatabase containing the raster outline feature, see the description for the Raster outline location further down. Following are some examples of raster paths:
- c:/mygeodatabase.gdb/myraster
- myrasters/my_relative_raster.png
- Choose pixel format. Choose 32 bit floating point to preserve the original amplitudes as a one-band raster that will be mapped to colors during rendering, or choose RGB to create a raster containing the colors that result from the color mapping of the amplitudes.
- The Raster Outline Location and name decides the name and location of the feature class that contains the boundary geometry for the section raster. This georeferenced boundary geometry positions the raster in space. If the feature class does not exist a new one will be created.
- Choose a Resampling Factor to decide the level of interpolation used when sampling the seismic amplitudes along the intersecting geometry. Choose 5 for the maximum interpolation. This will give you the best result but the processing time and size of the raster will increase. Choose 1 to skip interpolation.
- Click OK to begin the extraction process.
Once the extraction process is finished you will find the section as a newly created raster, either as a file on disk or in your geodatabase. The raster outline will exist as a feature in the provided outline feature class.
Visualizing extracted seismics
Once a line or section has been extracted from a seismic cube you can visualize the result in 3D by adding the feature class containing the raster boundary to the table of contents. Following are all the steps required to ensure that the extracted data is visible in the 3D window.
- Add the feature class containing the raster boundary to the table of contents
- Ensure that the outline feature is visible in the 2D map view. Use Zoom to Data if necessary.
- Locate the 3D Explorer toolbar. It looks like this : . If needed create the 3D window by clicking the 3D toolbutton.
- In the 3D Explorer toolbar click the Zoom to Map toolbutton : . This will align the 3D view to the 2D camera position.
- The extracted seismics should be visible in the 3D window. If not click the Refresh button in the 3D Explorer toolbar.


