Displaying well logs and seismic in 3D scenes
- Former user (Deleted)
- Stein Midtvaage
- Erlend Kvinnesland
Introduction
The documentation describes how to to display wells and wells logs together with seismic in a 3D scene.
The presentation has a practical aspect from exploration drilling. After the initial phase with seismic 2D lines the next phase may be to drill wells to investigate further the interesting structures.
The involved features in Geocap are:
Issues in Geocap when displaying well logs and seismic
- Setting up a Geocap project that will contain all the data
- Selecting command object menus into a dedicated set in shared commands
- Reading SEGY files with 2D seismic lines into the project
- Displaying 2D seismic lines
- Reading well files with all the logs in LAS format into the project
- Display the well string and all the logs in the 3D scene
- Reading and displaying well tops information
- Reading and displaying well log images
- Applying a workflow to assist displaying the data
The documentation is a summary of the applied features in Geocap with references to other part of the documentation where the items are explained in more details.
On this page:
Setting up a project
A project in Geocap can be generated generic; i.e. along its development. It is however nice to have an initial setup. The project in this text is just called Wells and logs and referred to as the project. Here is the initial setup for the project with wells and seismic lines.
The contents inside the folders will gradually be generated along its use. The example shows what this test project may look like.
Working with the project manager and setting up a project is explained in project manager introduction Geocap Projects.
Quick explanation of the folders in the project:
- Images. A folder to contain screenshots from the screen. Just a nice thing to have in order to save an informative display. The screenshots are taken by data->Screenshots
- Seismic lines. A folder to contain 2D seismic lines that are present in the wells area. A seismic line is read by Seismic lines->Import->SEGY-2D
- Well log images. A folder to contain well log images from some paper reports that are saved as images in a picture format (jpeg, png, bmp, etc ) and read into the project. They can be calibrated and displayed in the 3D scene attached to its well.
A well log image is read by Well log images->Import->Generic. Browse in the images and use Automatic reading. - Well tops. A folder to contain well tops. In this case the well tops are taken from NPD's facta pages.
- Wells. A folder to contain wells with all the logs. The wells are usually in LAS format and read into the folder with the LAS reader that is found under Wells->Import->LAS
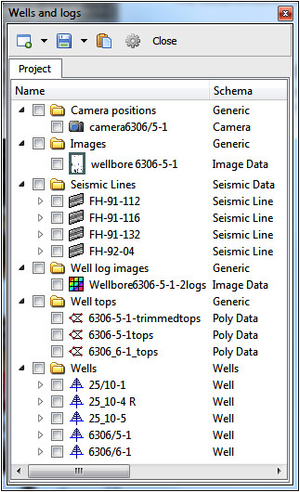
Example contents of the well project
Selected commands in shared commands
Schema commands and shared commands are essential in Geocap. Read more about these features here: Commands.
For this particular task a set of shared commands has been selected to assist the working process. If you don't have this selected set, download it from well logs, well image and seismic.zip and install it into Shared Commands using the folder icon or Import option. You may also go to the Operation Mode entry and Uncheck all and then only Check the options Wells and Calibration.
The selected set of shared commands will contain the primary commands that are necessary to use for this application and will make it easier for the user to find the correct command option. The set looks like the display to the right.
It is important to understand that the use of shared commands is a convenient option for the user. Generally one may also find the same commands on the right click menu together with a lot of other commands. The shared commands will thus be the selected set to be presented to the user as the most actual command objects for the specific task.
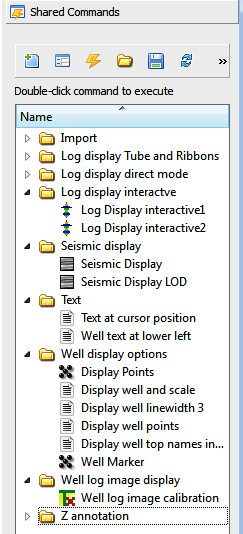
Set of shared commands used for displaying well logs and seismic
Explanation of the shared command set
The different command objects of the selected set in shared commands are organized according to their functionality. Here is a brief explanation of their use:
Import
Import well tops: X Y Z NAME
The format of well tops is:
Top depth (m) Litostratigraphic unit
379378.45 7065951.07 253 NORDLAND GP
379378.45 7065951.07 253 NAUST FM
379378.45 7065951.07 1041 KAI FM
379378.45 7065951.07 1125 HORDALAND GP
379378.45 7065951.07 1125 BRYGGE FM
379378.45 7065951.07 1409 ROGALAND GP
379378.45 7065951.07 1409 TARE FM
379378.45 7065951.07 1487 TANG FM
379378.45 7065951.07 1750 EGGA (INFORMAL)
379378.45 7065951.07 1762 SHETLAND GP
379378.45 7065951.07 1762 NISE FM
379378.45 7065951.07 1811 KVITNOS FM
The file is composed using information from the well log report in NPD's facta pages. The command object for reading the report is tuned for this specific format. If you have problems with the reading, put all the text into "" (example: "NORDLAND GP"), and use a free format reading. The field data name for the text shall be lito.
Log display Tube and Ribbons
Ribbon log display X dir

Ribbon log display Y dir

Tube log display
These display options are used when we want to see the well logs in tube or ribbon mode, see image below.
Log display direct mode
Log Display black

Log Display blue 180

Log Display green

Log Display pink 180

Log Display red

Log Display yellow 180
These display options are used when we want a quick visualization of the well logs. The name tells which color it is using and the number which direction. All the settings are up to the user to change in a real project. The changing is done in edit mode of the command object. One can copy and paste a command object and rename it according to the settings.
Log display interactive mode
Log Display interactive1

Log Display interactive2
These display options are used when it is necessary to work interactively with the log display. The interactive mode is achieved by setting Execution mode to Interactive.
Work interactively and set the parameters for optimum display. Copy and paste and rename a proper command object according to the settings.
In general this application is tuned for displaying seismic in the background. Below is some examples of well log displays and a 2D seismic section running across that well:

Well logs displayed in tube and ribbon mode
Seismic display
Seismic Display

Seismic Display LOD
Seismic display are provided with to options:
- Standard seismic display. It may be too smoothed to get all the details.
- Level of detail (LOD) seismic display. A rendering technique that has different resolution according to view distance. Recommended and should be used if the graphical card supports it
Text
Text at cursor position
Edit the command object and write in the preferred text. Then place the cursor at any position. In 2D mode this is done by just right click in the screen. Then press Execute.
Well text at lower left
Highlight a well and Execute the command object. The text is placed at the lower left of the screen.
Well display options
Out of the command objects in this folder one option will be emphasized.
Display well and scale
Highlight a well. Then Execute the command object. It scales the well to the middle of the screen and display a red line looked upright. Especially the scaling is important so that the well will be in focus. It is equivalent to well->Zoom to Data.
To display the well in a thicker line, execute Display well linewidth 3.
Well log image display
Well log image calibration
This is a command object for calibrating and display of a well log report taken from a paper. The image is read into a Generic folder. Then it is calibrated to be displayed along the well.
Read more about this in Calibration and display of well log images.
The Operation mode entry Calibration shall be checked in in order to see the command object Well log image calibration.
Z annotation
Out of the command objects in this folder one option will be emphasized.
Z annotate 100
Highlight a well. Then Execute the command object. The well line is annotated for each 100 meter. Just a quick way to display the height along the well string. The other command objects have similar functionality.
Well annotation is also found in the Log Display menu.
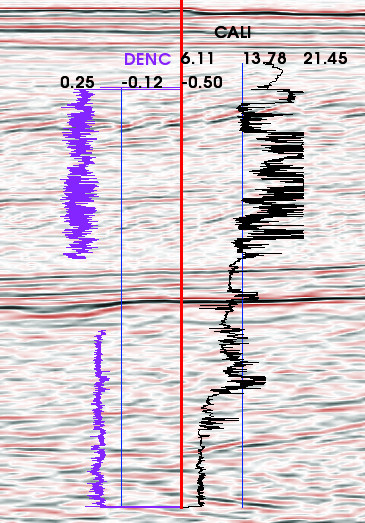
Well logs displayed in curve mode together with seismic
Applying workflows
Workflows are a convenient way to display a composite graphical scene. Below is examples of workflow elements for two wells.
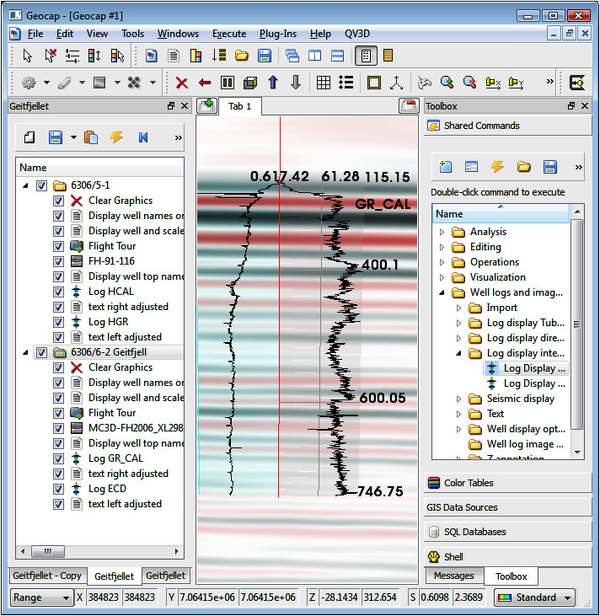
Well logs and seismic displayed by executing a workflow
A specific workflow has been prepared to guide and steer the application. If you don't have this selected set, download it from Well logs in 3D scenes.zip and open it using the File->Open entry. You must edit all the workflow elements to suit the specific project having relevant data.
Tips displaying wells and well logs
The two main features to control the display are clipping planes and focal point. Here is a list of some technical and practical tips when displaying wells and well logs:
Technical and practical tips when displaying wells and well logs:
- If it is hard to see a well the clipping planes may have been distorted. Erase the screen, zoom to well data and display. You may use the prepared command object Display well and scale.
- To set the focal point (rotation point), position the cursor on a graphical object, f.inst. the seismic section and hit x on the keyboard.
- To see a well from the y direction (i.e. from the side), use the proper icon on the toolbar.
- When you have a suitable set-up of parameters for a log display that you want to reuse, copy it, and rename it to a leading name. Enhance your productivity this way.
- Learn how to create workflows in order to present well displays efficiently for yourself and others.