Geocap 7.0 Release Notes
- Erlend Kvinnesland
- Tore Sannes (Unlicensed)
About this release
Release Date
Updated releases
- 7.0.1 - 16.12.2014
Release distribution
Geocap 7.0 is available from http://www.geocap.no/downloads to all clients under paid maintenance agreement.
Please note that you will need a user account to access this page. If you do not already have one, send an email to: support@geocap.no
Licensing
Installing a new license file: See our FAQ page and the document Installing on Windows.
Important
All clients will need a new license file in order to run Geocap 7.0. We will send new license files to all our clients under paid maintenance agreement. If you have not received a license file please contact us at support@geocap.no
Important
Geocap 7.0 uses a new resource folder, geocaprc-7, usually found in a folder structure similar to C:/User/<Username>/geocaprc-7/. If there are userscripts, startup scripts, color tables or shared commands you need, these will have to be imported over again. Userscripts may be copied from the previous geocaprc-6.4
You have to do the following before starting Geocap 7.0 for the first time:
Windows 7:
Start > All Programs > Geocap-7.0.x - xx > Licensing and right-click Initialize 7.0, then click Run as Administrator.
Windows 8.1:
Start screen > Apps view > Search for 'Geocap' > Right-click Initialize 7.0, then click Run as Administrator.
Supported operating systems
Geocap 7.0 runs on Windows 8.1, 8 and Windows 7. Both 32bit and 64bit versions of Geocap 7.0 are available on our download page. Both versions can be installed at the same time and projects can be used in both versions. In order to use the DataLink for ArcGIS you need to run the 32bit version. Consult this Microsoft support page to figure out which system type your are running on.
Project upgrade
All projects opened in Geocap 7.0 will all be irreversibly converted to a new project format. We highly recommend that you back up your projects prior to opening them in Geocap 7.0.
Highlights
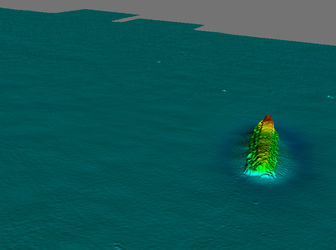
1. Water Column Data
In the Seafloor module we now launch the import, vizualisation and interpretation of Water Column data. Water column data are collected by multibeam echo sounders and is represents bacscatter in the watercolumn between the echo sounder and the seabed. Currently Geocap can read data from *.all and *.wcd files (from Kongsberg Maritime) only.
Geocap is using the same vizualisation technique for water column data as for the seismic data (brick technology).
The new commands in the Seafloor module:
- Import Multibeam Water Column Data: Read water column data after reading the depth data for the corresponding survey file.
- Display Water Column Swath: Display water column data (swath) from selected dataset(s).
- Extract Water Column Points: Analyze and filter the water column data and extract interesting features. This function is dependent on the seafloorwci feature in the license file.
- Display Water Column Points: Display the extracted points and use a tool for interactively changing the colour and visibility of the water column points. This function alseo need the seafloorwci feature in the license file.

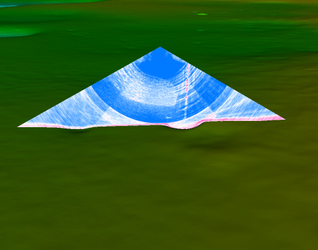
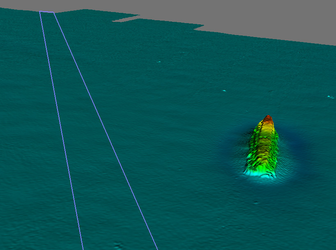
Water Column Swath and the survey line. The Water Column Swath.
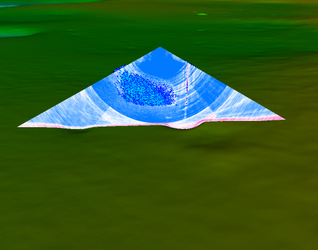
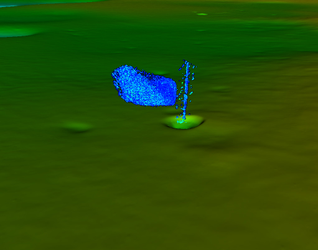
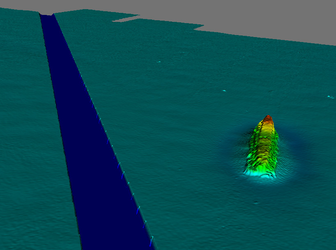
Water Column Swath and extracted points. The Water Column Points.
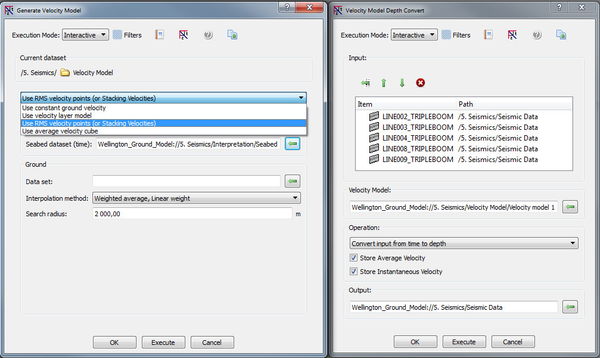
2. New Depth Conversion Concept
It is now possible to generate a velocity model in Geocap using the new command Generate Velocity Model. At this point there are four different types of velocity models available:
- Constant ground velocity
- Layer velocity model
- RMS velocity model
- Average velocity cube
Once the velocity model has been generated it can be used as input to the depth conversion in the new Velocity Model Depth Convert command. The command can depth convert the following datasets:
- Seismic 2D lines
- IHorizons (seismic interpretations)
- Poly Data (points, lines, polygons)
- Gridded horizons / surfaces (structured points)
3. Auto save and project save as..
You can now set up Geocap to automatically save your projects with specific time intervals. The option is available under Tools > Options > Projects
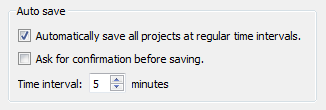
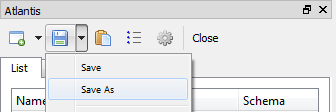
It is now possible to save your project with a different name using the new Save As option
4. Surface Cut/Fill volumetrics
The new command Surface cut/fill volumetrics is a new tool to easier calculate volume between two surfaces or between a surface and a set of polygons describing a cut surface.
The command will calculate the volume to cut and fill and the corresponding horizontal area for each, and write to a report saved in a Reports folder.
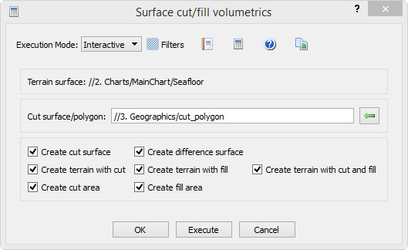
The command can also produce output surfaces for graphical presentation of the result, for instance the Terrain with cut, which is the combination of the cut data and the input terrain.
The surfaces are saved in a Volumetrics folder.
The original surface showing the terrain. The terrain and the cut (trench) polygon.
The terrain with the trenched area.
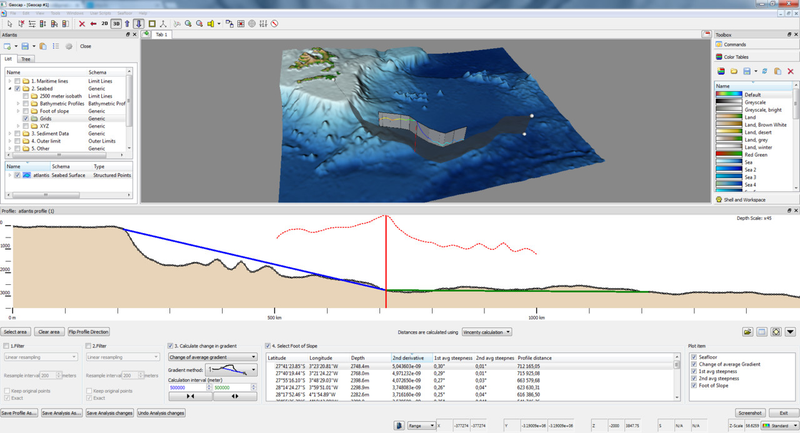
5. Digitize Bathymetric Profiles with more than two points
The Generate Bathymetric Profile command now lets you digitize any number of points on the profile before you end the digitizing.
This means it is now easy to generate profiles following ridges etc.
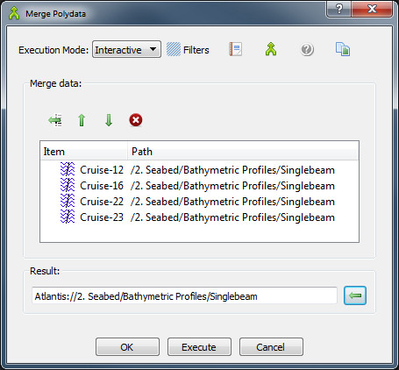
6. Merge polydata
You can now merge polydata into one dataset by adding different datasets to a list and specifying the output location. The polydata can be added from anywhere in your project and it is possible to specify the merging order.
This new command is available in the Operations folder under Shared Commands.
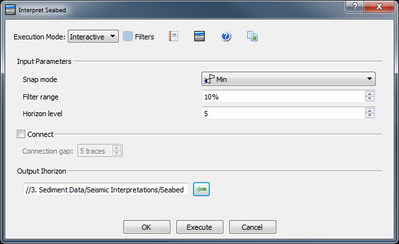
7. Auto Interpret Seabed
Geocap can now automatically track the seabed on seismic lines. The command can be executed from a folder containing several seismic lines and it will produce one Seabed horizon for all lines.
There user can decide if gaps less than a certain amount of traces should be connected and set the snap mode, among other settings. The command i available on seismic lines and folders.
 General
Reorganized commands in the Toolbox
In order to make it easier for you to work with Geocap and let you find the functionality you need faster we have cleaned up the Toolbox by regrouping some of the commands and hiding some of the commands which are not used that often.
If you can`t find a command that you are used to using you can add it to your Toolbox by right clicking a section or group and clicking New Command. It is also possible to copy the schema file from your 6.x installation to your 7.0 installation.
Copy the file C:\Users\<username>\geocaprc-6.4\usertypeschemas to C:\Users\<username>\geocaprc-7\usertypeschemas
Library upgrades
This release features a significant upgrade in our underlying visualization platform VTK and the Qt user interface library. This upgrade ensures maximum performance and compatibility across all hardware and operating system platforms.
Display
- The box that was drawn on startup has now been removed as default.
- It is now possible to adjust the saturation of Color Tables. Right click a color table and select Edit. Then use the Table saturation option.
- LOD grid display is now the default display for structured points.
- Map Sea and Map Land now uses level of detail as the method of display.
Gridding
- The Gridding command can now use hole polygons to limit the gridding
- The Gridding command can now use coastlines to limit the gridding
Project
- It is now possible to save a project with a new name using Save as on the project toolbar.
- It is now possible to save automatically with a certain time interval. Go to Tools > Options > Projects to turn this on.
Seismic and Interpretation
- New command: Interpret Seabed lets you interpret the seabed automatically. Run on a seismic line or a whole folder.
- Assign navigation now works on a folder
- The Gridding command is now available on Ihorizons
Seismic Shift now encompasses former commands Seismic Flattening and Adjust seismic using a correction line in one command. You may run the command from a folder level as well as from a single seismic line.
It is possible to create flattened/adjusted ihorizons.
- The flattening algorithm has been improved.
Operations
- New command: Merge Polydata lets you browse in lines or points into a list, from anywhere in your project, and merge these together. Available in Shared Commands > Operations. Lets you Volume calculation
- Clip grid vs. polygon. The new command Polygon Filtering lets you remove data in a grid inside or outside a polygon. The command can be executed from a Generic folder.
- Clip polydata vs. polygon. The new command Polygon Filtering lets you remove points in a polydataset inside or outside a polygon. The command can be executed from a Generic folder.
Volume calculation
- The new command Surface cut/fill volumetrics is a new tool to easier calculate volume between two surfaces or between a surface and a set of polygons describing a cut surface.
Cross Section Window
The cross section window has improved functionality when a line dataset is used as cross section path. This is ideal for examining a cable route, or a pipe line, but any line data can be used as a cross section path.
- There is a considerable speedup for point/line projection to a cross section path consisting of many points. It works very nicely with point cloud or multi beam echo sounder data.
- The cross section window will automatically detect which data is close to the cross section path in the graphics scene, and display the data in the cross section window. (You do not have to browse each dataset anymore)
- The cross section window has a new button which will enable an orthogonal cross section to the current cross section path. You can step along the cross section path with buttons, or interactively drag the cross section along the profile path.
- For cross section paths consisting of several line pieces, a combo box will appear, where the user can select which line piece to examine. This could be used with a line dataset with several pre-made cross section lines along a path.
Other
- Tools > Geographical management has been removed
- Point cloud editor no longer select invisible points
- Export to file geodatabase
- Export to PDF3D is no longer supported in this version.
 Shelf
Shelf
Seismic Interpretation and Depth Conversion
- New command: Interpret Seabed lets you interpret the seabed automatically. Run on a seismic line or a whole folder.
- The Ihorizon dropdown menu now updates in Generate Velocity profile command
Distance line calculations
- It is now possible to extract critical points as a separate dataset when calculating distance lines.
- Fixed 60M line calculation issue where there was glitch in the calculation of the envelope of arcs.
Midline/Equidistance calculation
- The Midline command has been renamed to Generate equidistance line.
- It is now possible to generate a dataset containing turning point connection lines.
- It is now possible to insert points on a equidistance line at a certain interval.
Foot of Slope
- The Generate bathymetric profile command will now let you digitize profiles with more than two points.
- New command: Merge Foot of Slope Points lets you collect FOS points from anywhere in your project into a list and merge these together.
- Fixed error in Average gradient calculation where changing calculation interval did not behave as expected.
 Seafloor
General
- The Make Boundary command renamed to Make Boundary and Holes. Is now able to create a polygon containing the interior holes in a points data set or a surface.
- The new command Surface cut/fill volumetrics: A new tool to easier calculate volume between two surfaces, or between a surface and a set of polygons describing a cut surface. The report will give both the cut and fill volumes and the area of the cut and fill. The command can also produce output surfaces for graphical presentation of the result.
- The Grid Function command can generate Slope (Dip/Gradient) surfaces and Aspect (Azimuth) surfaces.
- The new command Merge Polydata is useful for merging polygons and points data sets. The result data set will be of same type as the first (Poly Data or Pointcloud). Flags in the Pointcloud data will not be kept.
Gridding
The changes are valid for both the Gridding Files, Gridding Multibeam Data and the Gridding Charts commands.
- The gridding command can use interior holes in the gridding. The grid nodes will be undefined inside the holes. For Charts the dataset Holes must exist in the actual chart folder.
- The gridding commands can use a coastline polygon in the gridding. The grid nodes will be undefined inside the holes. The coastline polygon must be browsed in from the project.
- The older commands Old Parabolic and Surfit are removed from the menu.
Multibeam Survey data
- When the input survey data contains several motion and position sensors, all will be imported, not only the active system. All sensors can be vizualised and optionally edited.
- Import of water column data implemented.
- Upgraded to GSF version 3.06.
- The Point Cloud Editor has got a new tool named Select Ping. After selection of one or more points, this tool will select the rest of the points in the corresponding ping(s).
The Vessel Configuration Manager (for multibeam data)
- All transducers and receivers will be shown in the menu. The operator can change any offset value.
- The operator can select to switch between the imported sensors.
- All sensors can be replaced by an imported data set.
Multibeam Water Column data
Implemented import and vizualisation of Water Column data. Currently Geocap can read data from *.all and *.wcd files only.
The new commands:
- Import Multibeam Water Column Data: Read water column data after reading the depth data from corresponding depth file.
- Display Water Column Swath: Display water column data (swath) from selected dataset(s).
- Extract Water Column Points: Analyze and filter the water column data and extract interesting features. This function is dependent on the seafloorwci feature in the license file.
- Display Water Column Points: Display the extracted points and use a tool for interactively changing the colour and visibility of the water column points. This function alseo need the seafloorwci feature in the license file.
Cube
- Done some cleanup in the Cube menu and removed some combinations of algorithms and output.
- Updated the documentation of Cube in the User Guide.
- Changed the name of the result surface.
Points Classification
- The method for extracting Saddles is rewritten. The search for saddle points is done by checking the values along the X and Y axes, and also the diagonals through each grid node.
- The method for extracting Valleys and Ridges is rewritten. The search for valleys and ridge points is done by checking the values along the X and Y axes, and also the diagonals through each grid node. Also the sharpness of the feature is checked by specifying the angle of the contour line through the selected node.
 Ground Model
Project
- There is a new project template in the Ground Model module tailor made for data and workflows normally used within Ground Modeling
Seismic and Interpretation
- Geocap can now automatically track the seabed on seismic lines. The command can be executed from a folder containing several seismic lines and it will produce one Seabed horizon for all lines.
- It is now possible to assign navigation to multiple seismic lines in one operation.
- The command Gridding has been made available for iHorizons
- A new option for Arc seconds has been implemented for SEG-Y import
Fixed error in Seismic Subset command where seismic was not limited by input surface.
Seismic Shift now encompasses former commands Seismic Flattening and Adjust seismic using a correction line in one command. You may run the command from a folder level as well as from a single seismic line.
It is possible to create flattened/adjusted ihorizons.
Depth Conversion
- Ground Model now comes with a new depth conversion concept supporting several types of velocity models, and lets you depth convert multiple datasets and folders in bulk.
- Adjusting seismic using a correction line now works on a folder level.
 DataLink for ArcGIS
- Feature layer display will now honor any definition query that has been set in ArcGIS.
- It is now possible to paste multiple datasets and/or folders into a file geodatabase.
- Geocap will now try to replicate the symbology used in an ArcMap ducument when displaying the data in Geocap.