Geocap 6.3 Release Notes
- Erlend Kvinnesland
- Rasmus Bording (Unlicensed)
- Former user (Deleted)
About this release
We are proud to present Geocap 6.3 which contains considerable technological advances in the areas of seismic data loading and seafloor data management. See our illustrated highlights section.
Together with improvements in everything from workflow recordings to arbitrary image georeferencing Geocap asserts itself as a true multipurpose tool for the geoscientific community.
We discovered a potentially serious bug in our Oracle connection in Geocap 6.3.0. This release has been replaced by Geocap 6.3.1, which is available from our download page.
Recommendation:
1) Do not connect Geocap 6.3.0 to any Oracle database.
2) Uninstall Geocap 6.3.0
3) Download and install Geocap 6.3.1
Please note that the use of Geocap 6.3.0 is OK for any other purpose than connection to Oracle databases.
Updated releases
Release distribution
Geocap 6.3 is available from http://www.geocap.no/downloads to all clients under paid maintenance agreement. Please note that you will need a user account to access this page. If you do not already have one, you can register at: http://geocap.no/user/register
Licensing
Important
Geocap 6.3 requires a new license file.
All clients will need a new license file in order to run Geocap 6.3. We will send new license files to all our clients under paid maintenance agreement. If you have not received a license file please contact us on support@geocap.no
Installing a new license file: See our FAQ page and the document Installing on Windows.
Important
You may need to initialize the license the first time you have installed Geocap 6.3 on a new machine.
Go to : Start > All Programs > Geocap > Geocap-6.x > Licensing and right-click Initialize, then click Run as Administrator. (You only need to do this once for a particular computer)
Supported operating systems
Operating system | System type |
|---|---|
Windows 7 | 64bit and 32bit |
Windows Vista | 64bit and 32bit |
Windows XP | 64bit and 32bit |
Geocap 6.3 is currently not available for Linux or Unix, contact support@geocap.no if you want more information on this.
Both 32bit and 64bit versions of Geocap 6.3 are available on our download page. Make sure to download the correct one.
Consult this Microsoft support page to figure out which system type your are running on. (Or you may try Properties on Computer)
Some highlights in Geocap 6.3
1. New seismic brick cube technology
Brick technology allows you to display and process arbitrarily large 3D seismic datasets using parallel processing and brick partitioning.
This technology was developed for handling huge datasets on relatively small computers. We have successfully imported a 314 Gigabyte SEG-Y file and run the visualization on a laptop computer.
Brick technology in Geocap
2. Multibeam editing and flagging in 2D and 3D
Multiple multibeam survey lines can now be edited in both 3D view and 2D cross section view simultaneously. The same editing capabilities are available both in 2D and 3D.
The editor has undo/redo functionality. Deleted points are only flagged (marked) as deleted, and can easily be un-deleted at a later stage.
The new Point Flag Visibility Filter dialog lets you easily control the visibility of any set of XYZ points according to their flags. When adding filters the default mode is Hide.
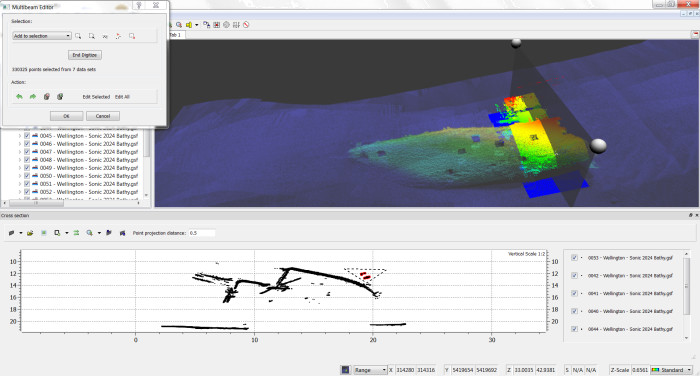
Editing in both 2D and 3D
3. Georeferencing - Morph and World pick
The Geo Reference command will now show the image/map in a standalone window. This enables you to pick reference tie point from displayed data in the graphics window using the World Pick button.
A new georeferencing method has been added. Morph image can be used to force an image/map to fit, using an arbitrary number of tie points. The new image will have a 100% match in the position of the tie points.
In the area between tie points, the image will be interpolated smoothly. Using this option, the new image is a re-sampled version of the original image.
A new Preview button lets you evaluate the result by displaying it in the graphics window together with other data, before completing the georeferencing.
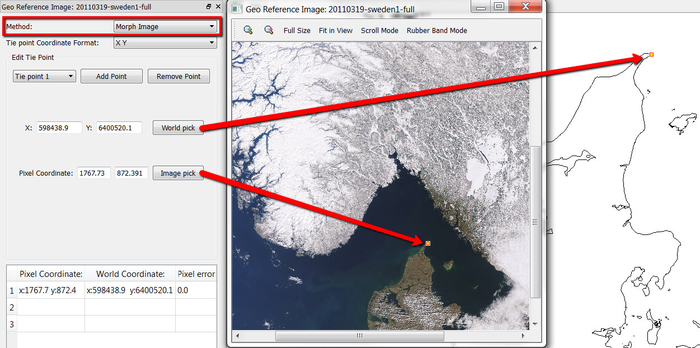
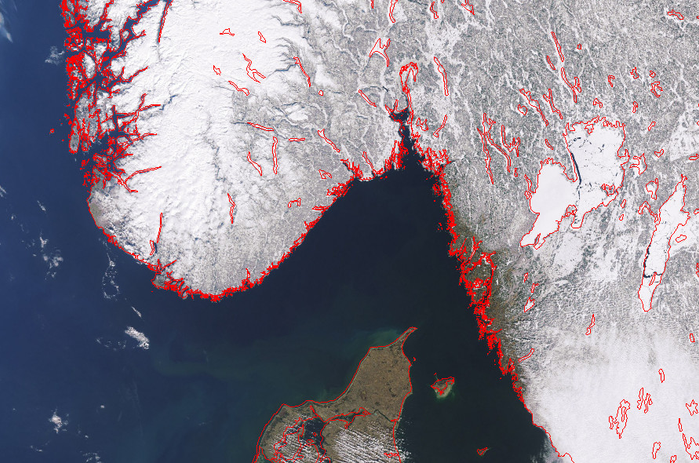
Showing the georeferencing process and the result
4. Workflow Recorder and easier data input
The workflow recorder makes it easier than ever to create and modify workflows. Start recording, and commands will automatically be added as elements to the workflow as you make your visualizations from the project.
Several other improvements have also been added. By copying commands from the Toolbox and into the workflow, the selected dataset in the project will automatically be used as input data.
To change input data, simply select the dataset in the project and click the ![]() icon.
icon.
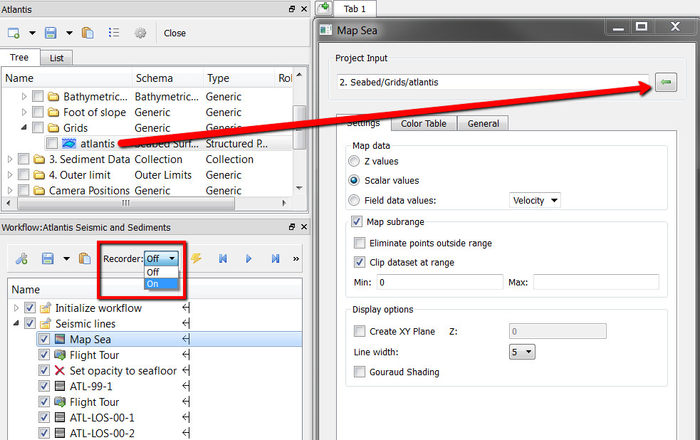
Workflow example
5. Default commands
Project datasets now have a default command that are directly accessible in the dataset's Properties dialog. A default command is executed when the dataset is checked in the project view.
Choose an item commands or a schema commands and click on the  to mark the command as the default command.
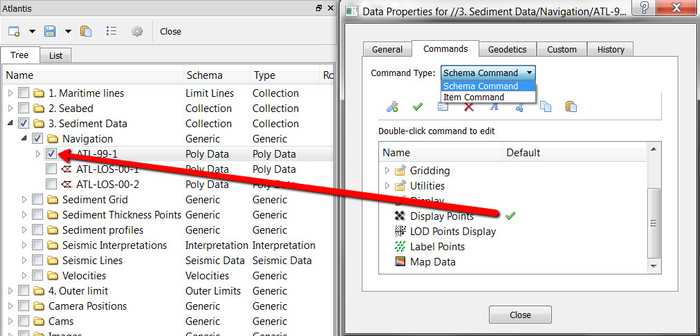
Setting the default command in the properties dialog
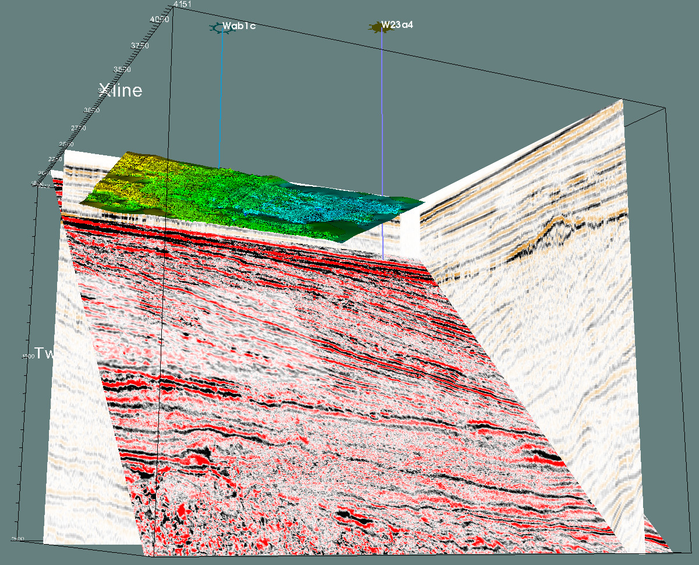
6. Adjust Seismic
The new command Adjust seismic using a correction line contains functionality for adjusting seismic by grid surfaces, interpretations, digitized lines or correction tables e.g. tidal corrections.
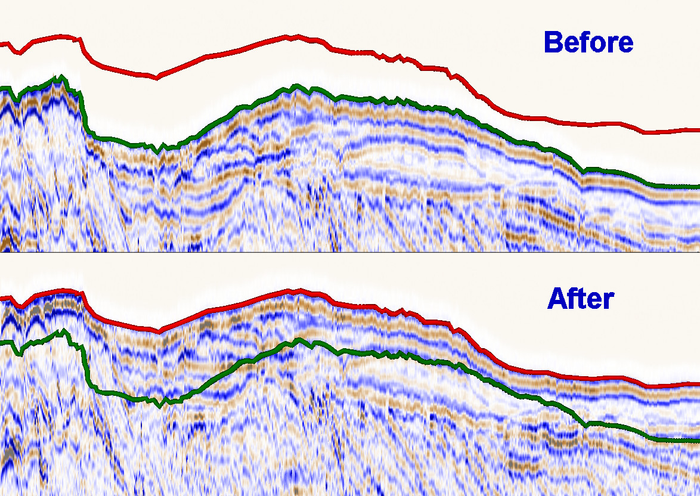
The upper section is the initial (Before) situation showing a green interpretation line on the seabed and a red line where the section intersects with the multibeam grid surface. The lower section (After) shows the adjusted seismic, now shifted to the red line. The abandoned green line is displayed just to visualize the distance the signal has been shifted.
Other seismic manipulating commands for depth conversion and creating seismic sub-sections has been present for a while.
7. Seismic visualization
Ever wondered what is hiding behind the watercolumn part of your seismic section? In Geocap 6.3 the command Seismic Subsection removes/makes transparent the seismic above a line, an interpretation or a grid surface. In addition Seismic Subsection is used for creating sub sections limited by shot point range, Z-value (or inline/crossline range for 3D seismic).
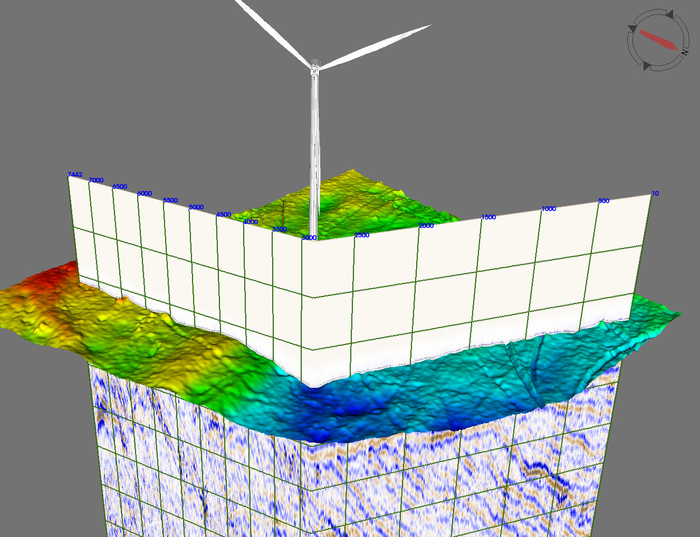
Default situation - the watercolumn is displaying in front of whatever is behind.
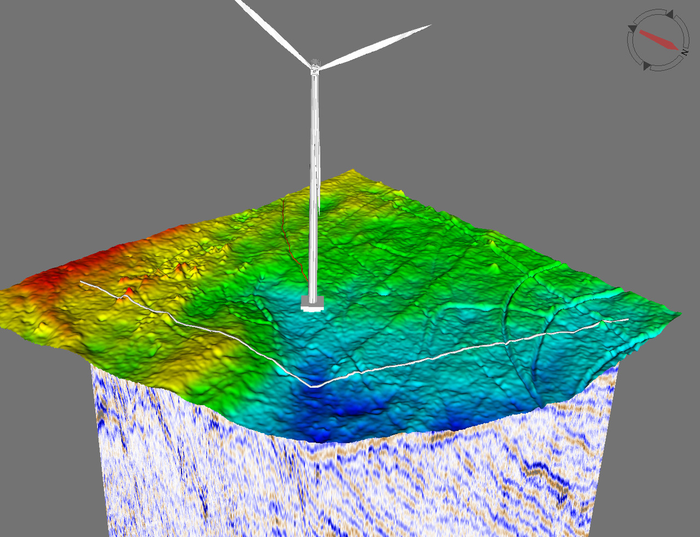
Use the command Seismic Subsection to chop of not needed portions above/below/outside a line/an interpretation or a grid surface.
8. Display interpretation from a Seismic Line
In earlier Geocap versions you had to manually locate the interpretation from the project or through the main Interpretation panel. In 6.3 a new command Display IHorizons has been added to the Seismic Line schema.
This command lets you browse in your interpretation folder and then select which horizons to display for that specific seismic line. For efficient use on ongoing interpretation projects,
this may be switched to direct mode and set as an item command after the initial settings are set.
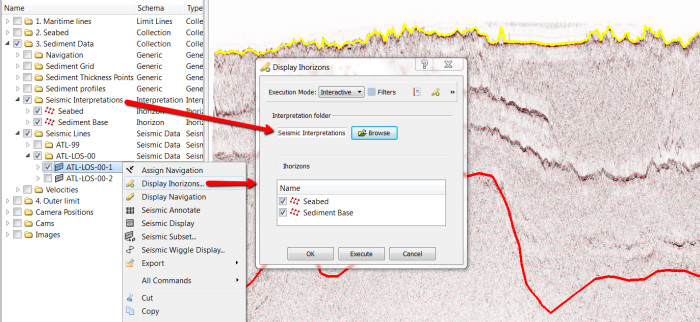
Interpretation display
Interpretation: You may now use Space or p from the keyboard to do new pics in your interpretation. Using Space may reduce the risk of strain injuries.
9. Calculate vertical, horizontal and total distance
Previously it was only possible to meassure the total distance in 2D and 3D. Now it is also possible to measure vertical and horizontal distances in 3D. When in 3D mode, press Y on the keyboard to set start and endpoints.
All the distances will be listed at the bottom of the panel. A white line will show the measured distance.
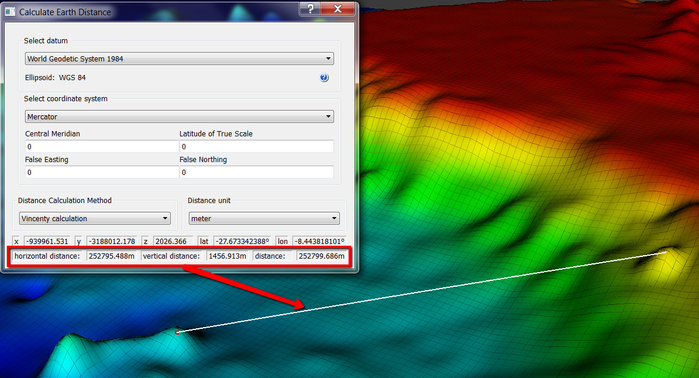
Distance calculation in 3D
General
- Edit > Recent projects will now preserve the data listing and sorting in File > Recent projects.
- Several improvements has been made to the LOD Grid Display and LOD Points Display commands.
- Scripted commands may now be set not to copy project data to workspace during execution. This option is available as a check box on the edit menu. Using this option will improve the execution time significantly for some commands.
- Save added to the right click entry on schema and shared commands.
- Distance calculation can now calculate vertical, horizontal and total distance in 3D by pressing Y on the keyboard. It will also show a line between measured points. See highlights above
GUI
- A new concept: Default command has been introduced (see illustrated highlights above). The user can now decide witch command should be executed when clicking the check box next to a dataset in the project. This functionality is available on the Properties menu on a dataset, under a tab called Default Command. Specify a command type first, either Item Command or Schema Command, then select which command to use by clicking the icon.
- Keyboard key x, to set the focal point, now works for all kind of points display. Previously you had to point at an object displaying a surface.
- Set Geodetic Properties dialog now has Cancel button.
- The project now has a List tab. This will enable you execute commands on a selected number of files within a folder. Double click folders to go one level down, and click on the up arrow to go one level up.
GIS
- Display simple features has been removed as default item command for Simple Feature Layers.
- Item commands are now preserved for simple features layers.
- Geocap will now remove GIS data source properly.
- The Display Simple Features command can now be opened in workflows.
Seismic
- Fix: Seismic Subset from a Seismic Data folder will name resulting subsets after the individual seismic datasets, not folder name.
- New command: Adjust seismic using a correction line adjusts the Z-values of the samples (e.g. to align seabed reflector in seismic with actual seabed), see illustrated highlights above.
- New command: Display Ihorizons, interpreted horizons can be displayed directly from the Seismic Line, see illustrated highlights above.
- Improved commands for Seismic Lines
- Seismic Annotate: improved annotation offset and coincident topology
- Seismic Display: improved handling of undefined values (transparency)
- Seismic Subset: creation of subset above/below/between limit line(s)
- The new Brick technology allows Geocap to handle seismic 3D cubes of any size using parallel processing and brick partitioning. See also videos and images in the highlight section above.
- Seismic Brick Cube has new command Seismic Filter with the following filters included:
- Anisotropic diffusion
- Bandpass
- Trace mix.
- Undefined values are transparent and has a vague outline in Seismic Brick display
- See also GIM
Workflows
See also illustrated highlights above
- It is now possible to record Workflows.
- Set the recorder to On and a red light will start blinking.
- Start executing commands and the workflow will automatically remember the commands you execute.
- Set the recorder to Off to stop recording.
- When you copy commands from the Toolbox and paste them into a workflow, the selected dataset in the project will be used as input data.
- When you paste commands into a workflow they will automatically show up in Edit mode.
- It is now possible to set the project input by selecting a dataset in the project and clicking the green arrow in the workflow element editor.
- Workflow element editor now correctly cancels project input if user clicks the Cancel button.
- It is now possible to use the command Display Simple Features in workflows.
- Flight controller is now in front of workflow execution controller, which makes it possible to stop a flight tour during the execution of an entire workflow.
Georeferencing
See also illustrated highlights above.
- It is now possible to georeference inaccurate or low-quality maps using the new Morph option. This option will "stretch" the image between a arbitrary set of reference points.
- The new image georeferencer will now open the image in a 2D viewer. This is where you now pick reference points in the image.
- It is now possible to select points from the graphics window by using the World Pick button, instead of typing in coordinates manually. This way you can georeference and image based on recognizable features such as the coastline etc.
- A new Preview button has been added, which lets you see the result before you finish the georeferencing.
Cross section Window
- LOD point display in Cross section window has been improved.
- It is now possible to browse in line data as cross section path.
- A legend control button has been added to the cross section view, making it possible to disable the legend, or change the position of the legend.
Plotting
- A new command Quick plot has been created. This can be executed on grids, and will create a simple plot. The command is available in our Shared Commands that can be found under Geocap Extensions.
- The Scale bar can now be set to meters.
Documentation
Our online documentation can be found here: www.geocap.no/doc
- We have updated the front page of our online documentation to give easier access to different topics.
- A FAQ has been added to our online documentation.
- A new entry called Geocap Extensions has been added to our online documentation. Here you will find more information and downloads for Shared Commands, Area Generator and other scripted system.
Scripting
- User Scripts has been moved to the main menu in Geocap. Scripts placed in 'C:/Users/username/geocaprc-6/userscripts' will be available on this menu. For more information go to: User Scripts > Help.
- The shell command tma has been improved.
- A new shell command rubberband select has been added. This command enables you to draw a rectangle and then receive the coordinates of the rectangle.
Modules
GIM
New:
- Surface Interpretation comes with complete surface editing, including
- Surface merge
- Cut inside/outside polygon
- Expand surface by interpolation and/or extrapolation
- Back-snap surface (e.g. surface created from filtered seismic snaps back to time/amplitude from original seismic)
- Preview slice tracking for brick cubes is supported.
- Isolate interesting geological regions by filtering tracklines based on per line attributes such as length, dip, average amplitude etc.
Improvement:
- Improved surface generation features diagonal and dual zero tracking.
- Cleaned up compile flags.
Bugfix:
- Opacity specified through vtk now works on seismic brick cube display.
- Surface interactive now works for brick cubes.
Shelf
- Distance line connection polygons will now be given a named different from regular distance lines.
Seafloor
See also illustrated highlights above
New:
- Any number of multibeam survey lines can now be edited simultaneously in the 3D graphics view. The editor has undo/redo functionality. Deleted points are only flagged as deleted, and can easily be un-deleted at a later stage.
- A new 2D view lets you view and interact with a cross section of multiple survey lines in combination with other data by sliding a cross section pane through the 3D graphics scene.
- Multiple multibeam survey lines can be edited in a 2D cross section view. The same editing capabilities are then available both in 2D and 3D.
- The new Point Flag Visibility Filter dialog lets you easily control the visibility of any set of XYZ points according to their flags. When adding filters the default mode is Hide.
- A new option to revert flag for user deleted (edited) points in the command Revert Flagged Points has been implemented.
- It is now possible to copy the information in Show Chart/Survey Line/Dataset properties, and paste into e.g. Excel. Right click the list and select Copy.
- A new pulldown entry Edit has been added to the Seafloor Main Menu.
- A new entry to the Multibeam Editor has been added under Seafloor Main Menu > Settings > Edit
- A new method for Deep and Shoals classification has been implemented.
- A new command Polygon Filtering for removing points inside/outside one or more polygons has been implemented on the Multibeam and XYZ data folders.
Improvement:
- The Point flag mechanism has been improved a lot. Multiple flags are allowed for each point.
- Import Multibeam Sonar Data will now report number of (active) points for each survey line and total for all lines.
- The Properties dialog for Multibeam Survey data object and all the children (sensor data) have been much more detailed. The top element's properties also contains information from the children (Gyro, Heave, Roll, Navigation etc.)
- The Gridding Multibeam Data check box text Use Boundary Polygon has been changed to Use Automatic Boundary Polygon for the Parabolic algorithm.
- Display Chart Data: It is now possible to display both Soundings and Seafloor datasets without using color range, by just using a solid color.
- A message will appear if you execute Display Chart Data without having any charts selected.
- The volume calculation has been improved and now supports both Cut and Fill Volume, and Cut and Fill Area.
- Several tool tips, icons and help texts has been added/improved.
- The Seafloor User Guide has been updated.
Bugfix:
- Fixed crash in constant gradient algorithm if layer speed is equal to transducer velocity.
- Simrad .all files range78 datagram will now skip ping if no matching swath ping can be found.
- Test on bad allocation when opening datasets in command Extract Soundings.
- The command Multibeam Depth Filtering will now check the number of selected datasets, and return an information message if no datsets are selected.
- Editing has been disabled in all properties tables and file selection views.
- Rotating (waiting) cursors has been removed from Question and Information dialogs when executing commands.
- Fix in real-time flagging for EM 710 data
- Other minor fixes
Oil & Gas
- The manipulator has been updated to handle rotated velocity cubes.
- A simple well log zonation method is introduced for vertical wells.
Known issues
Seafloor:
- Export of format S57 sometimes fails. Will be fixed in near future update releases.
PDF3D:
- Limited text character support. I.e. no unicode support.
- Point size is unsupported and points are always black.
- Line thickness is unsupported.
- Rendering of transparent geometry is wrong from certain view directions
- Geometry and or camera 'far' away from the origin generates problems for Adobe Reader.
- LOD display is unsupported.