Well log zonation and display
- Former user (Deleted)
- Erlend Kvinnesland
Well log zonation of well tops
The documentation describes how to perform zonation of well logs to determine well tops. The well logs must be present in a project as shown below. The menu features and technical processes are simple and easy to operate having read the documentation and done some training to feel confident.
The purpose of well log zonation is to determine the major reservoir zones and to extract well tops at the zone transitions to separate files. The zone boundaries are crucial setting up reservoir models and performing volumetric.
On this page:
Well log zonation menu
The actual command menu is called Well log zonation and display and is found under Shared Commands->Visualization. Activate the command on the preferred well log.
Features in the *Well log zonation and display* panel
- Display various logs in the same graphical window for easy zonation.
- The zonation text is taken from a prepared text file located in the project.
- Zonation is performed using a line manipulator that makes it easy to consider several logs when doing zonation.
- Width of log display can be adjusted individually for each log.
- Color settings for logs and color table for the zones.
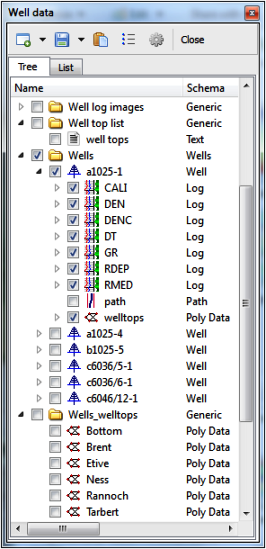
Project with well data used in the zonation
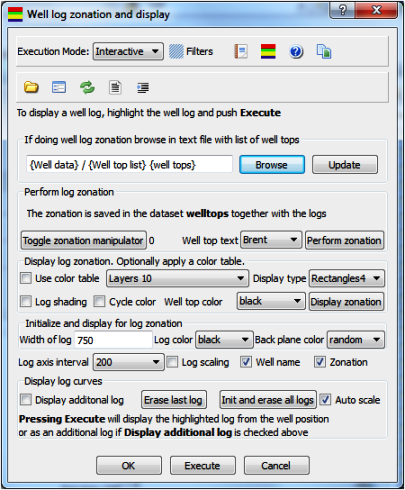
Menu for well log zonation and display
Displaying well logs
Before doing any zonation the well logs have to be displayed. This is done most easily by highlighting a well folder containing all the logs or the log itself and push Execute.
Various ways to display well logs
- Display one log: Highlight the log and push Execute
- Display an additional log: Highlight the log and push Execute
- Display all logs: Highlight the well log folder and push Execute
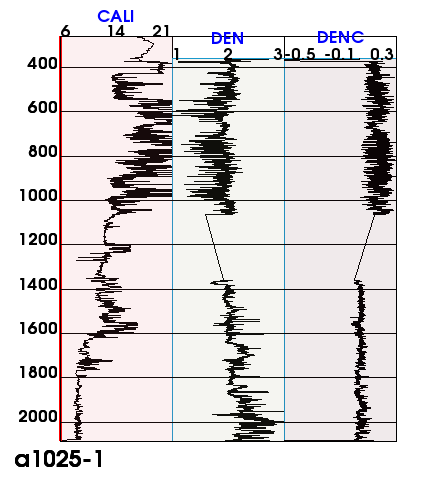
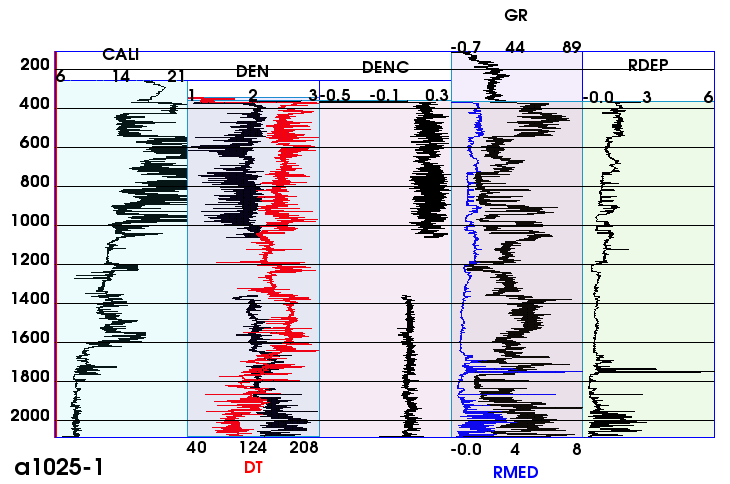
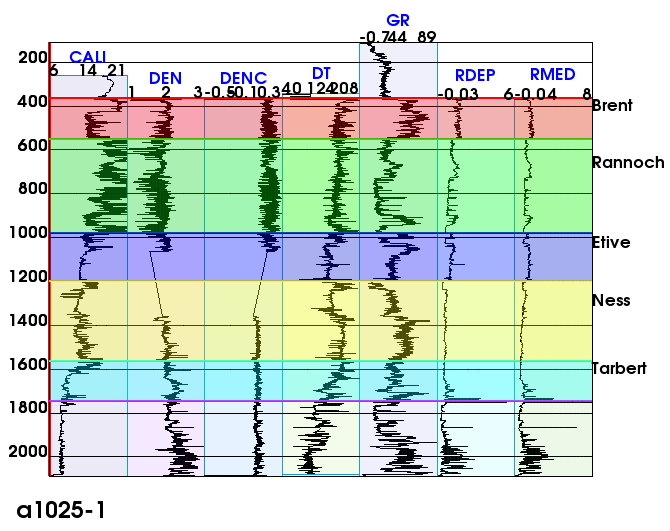
Three well logs are displayed simultaneously
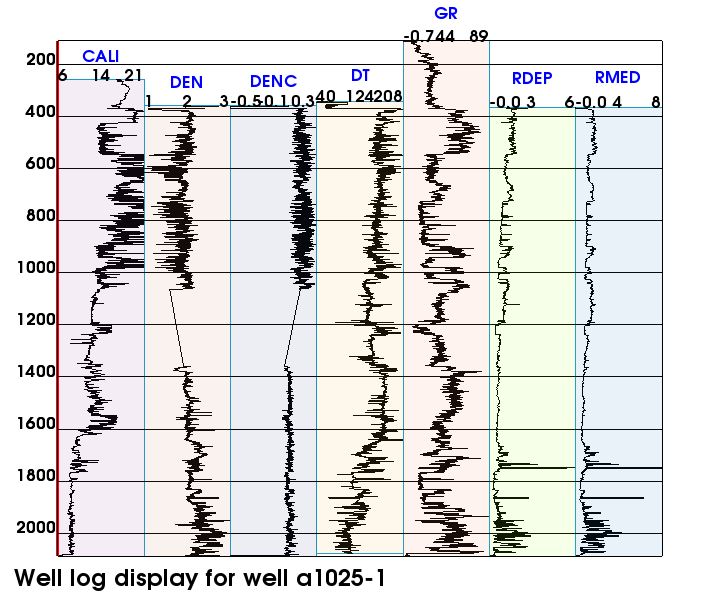
All well logs are displayed simultaneously
If the menu is activated and executed on the top wells folder containing all the wells the log display for the various wells will be displayed in separate graphical tabs.
The well logs are displayed in 2D view along the x direction from the well position. Enter 3D mode to display other data sets that belong to the scene.
Option in displaying well logs
Alternative ways to display well logs
- Display one log: Highlight the log and push Execute
- Display an additional log: Highlight the log and push Execute
- Display a new log in the last log display: Turn off Display additional log. Turn on Cycle color or set new Log Color. Push Execute
Well logs can be displayed together in the same log view. First one must highlight the new log that shall be displayed in the same log view as the previous log. Then turn off Display additional log and select a new Log color or check in Cycle color.
Display of well logs where some well logs are displayed together in the same log view
After displaying two logs in the same log view Display additional log will automatically be turned on for further display. Set also the log color back to the preferred color.
Log shading can be used in log display by checking in Log shading. Various colors will be used if Cycle color is checked.
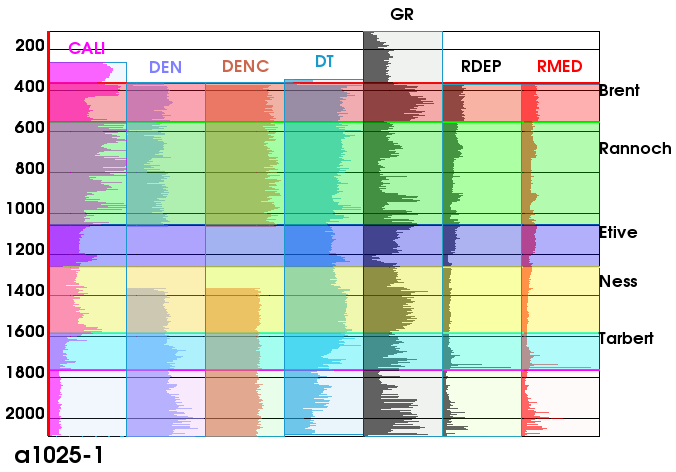
All well logs are displayed simultaneously with log shading and color cycle
Perform zonation of well logs to find well tops
Zonation is performed using these steps
- Prepare the zonation names in a separate text file; in this case called well tops and located in a standard Generic folder. The contents of the text file is the zonation names as shown.
- Browse in the well top zonation text from the text file in the project. If the text file is changed one should click Update to get the new changes.
- Display the selected logs (if not all of them) to be used in the zonation.
- Activate Toggle zonation manipulator to get a line that can be moved using the cursor. Position this line where the zonation is to be performed.
- When correct zonation is achieved push Perform zonation. Be sure the Well top text is set on the correct zonation name.
- Shift the Well top text to the next zonation name and position the manipulator line over again.
- When the next zonation level is correct set and the text is correct push Perform zonation again.
- Repeat the zonation process until finished and toggle off the manipulator line.
- Be aware that there is a Bottom name in the text file just to perform the zonation where the last zone ends.
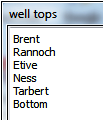
Well log zonation text
The display to the right shows a snap shot of the zonation process when two zones have been established. The line manipulator is shown in green. It is actually a line cross so one can also have a vertical control of the log values.
The zonation registration is saved in a file called welltops and is part of the well log folder. If a zonation has to be altered just perform that zonation over again and the welltops file will be updated. When the welltops file is present the default display of the well logs will also show the zonations unless the Zonation display check box is toggled off.
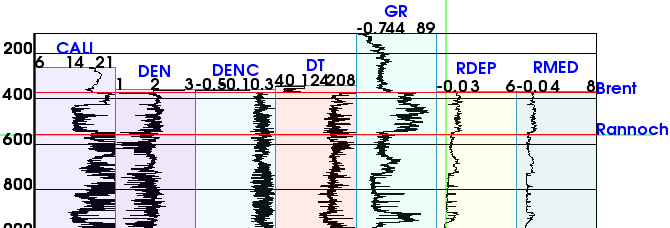
Well log zonation procedure is now performed for the two top zones
Final zonation display
The final well log zonation are displayed with all the logs and zones. The color off the zones can be changed using a dedicated color table. Such a color table must be edited in the section for Color Tables and then browsed in. The present display use the default color table.
If one wants to display the various logs with different width that has to be done individually. To display from scratch; i.a. have an initial log display click Erase and Init all log display. Then just highlight a log; set the desired width and click Execute. Repeat this for all the logs that should be part of the display.
Whether a log should be displayed as the first or as an additional log is controlled by Display additional log.
The zonation file welltops is part of the well log and can be inspected by Table View. The zonation names are saved as field data for every well position.
Well log zonation result
Extracting well tops of same zone from zonation data
Each well log saves the zonation data in the welltops file. There is always of interest to sort all well tops belonging to the same zone into separate files. That is done with the command Well log zonation and extract to well tops which is found under: *Wells -> Shared Commands -> Operation -> *.
Highlight the top well folder and click Execute. The result is saved in the folder Wells.welltops. In this file all well tops from the different well logs are sorted into the same zone. Then it is possible to grid up surfaces and make a quick reservoir model directly from the well data.
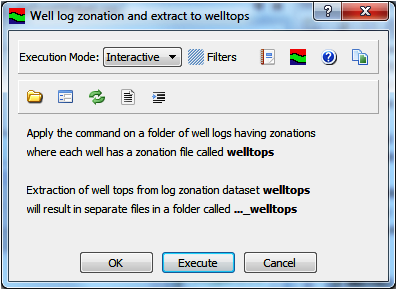
Menu for extracting well tops from zonation
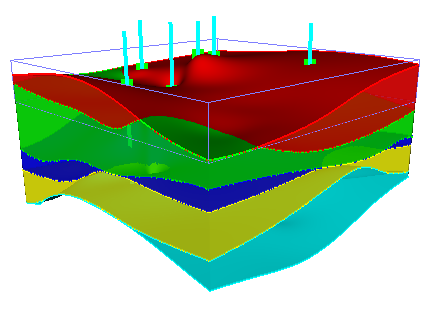
Making a reservoir model from well tops