Prospect and risk analysis
- Former user (Deleted)
- Olav Egeland (Unlicensed)
- Erlend Kvinnesland
Prospect analysis of recoverable oil and gas using Geocap
The Prospect Analysis module in Geocap performs montecarlo simulation of recoverable oil and gas volumes in a reservoir model. Such calculations are mandatory in all concession rounds and also when evaluating any prospect. All the parameters connected to calculating recoverable oil and gas can be modeled as uncertainty distributions. Thus the prospect analysis module will calculate a volumetric distribution for recoverable oil and gas instead of just one volume number.
The Prospect Analysis module uses the volumetric distribution curve to calculate the statistical values for the various percentiles. These values tells the management the chance for a good prospect given correct input uncertainties.
In this section:
Brief explanation of prospect analysis
Recoverable oil and gas are calculated according to the formula:
V_recoverable_oil/gas = Vr x Por x (1-Sw) x Ng x Bo x Rec
Vr = rock volume
Por = porosity
Sw = water saturation
Ng = Net to gross ratio
Bo = Oil/Gas expansion factor
Rec = recovery factor
Each parameter is inputted with a probability curve for its distribution of valid data. The rock volume distribution curve can also be generated in the Model page of the menu by setting up rock volume modeling parameters and calculating the rock volume a large number of times thus creating a rock volume distribution curve which can be inputted to the stochastic volumetric formula.
The prospect analysis algorithm runs a montercarlo simulation and calculates the recoverable volumetric distribution (RVD) curve. The RVD can be displayed in a histogram and in density and cumulative probability curves. The RVD curve is likely to be log normal distributed when several independent stochastic parameters are multiplied together. If the input curves are cropped or otherwise peculiar shaped, the RVD curve is likely to be normal distributed.
The post processing of the recoverable volumetric distribution (RVD) curve can thus be according to three choices:
- The distribution curve as it is
- As a log normal distribution
- As a normal distribution
In all cases one can display both density and cumulative curves and calculate interval of confidence. A dedicated display and graphic menu page will provide graphical presentations to the screen for volumetric reports.
Brief explanation of risk analysis
Prospect risking uses three or six parameters in the formula:
Prospect risking using three parameters:
Prospect risking = SR x TR x RR
SR = Source Risk
TR = Trap Risk
RR = Reservoir Risk
Prospect risking using six parameters:
Prospect risking = SOR x MR x TPR x TER x RPR x RQR
SQR = Source Presence Risk
MR = Migration Risk
TPR = Trap Presence Risk
TER = Trap Efficiency Risk
RPR = Reservoir Presence Risk
RQR = Reservoir Quality Risk
The risk analysis algorithm runs a montecarlo simulation and a prospect risk distribution curve (PRDC) is found. The PRDC can be displayed in a histogram and in density and cumulative probability curves. The PRDC curve is likely to be log normal distributed which is according to the theory when several independent stochastic parameters are multiplied together. If the input curves are cropped or otherwise odd shaped, the PRDC curve is likely to be normal distributed.
To start prospect and risk analysis in Geocap
Basic steps for applying the module:
- Load the prospect analysis plug-in. This is done initially by applying Plug-Ins->Load and follow the path and loading ...\modules\prospectanalysis\prospectanalysis.dll.
- Create a Generic folder and set the schema on the folder to Prospect Analysis.
- Two command objects are now visible by right clicking on the folder:
- Prospect analysis …
- Prospect risking ...
- Activate the preferred menu and start prospecting.
The menus are meant for persons familiar with geoscience and volumetrics with a good understanding of reservoir parameters and uncertainty principles. Otherwise call Geocap for some training and support.
Below are some snapshots from the prospect analysis menus and graphical displays connected to input of uncertainty distribution and output from the prospect analysis itself. Many more displays are possible to produce, but they are in principle of similar type.
The module gives vital information about reservoir prospects in the early phase of its life.
Menus and graphical results
The images presents the module in a visible form enabling the user to envisage the use and results. The user should follow the steps in the menu and achieve similar result with relevant data. Controlling the input and model parameters through display of initial distributions is important to get reliable result out of the analysis.
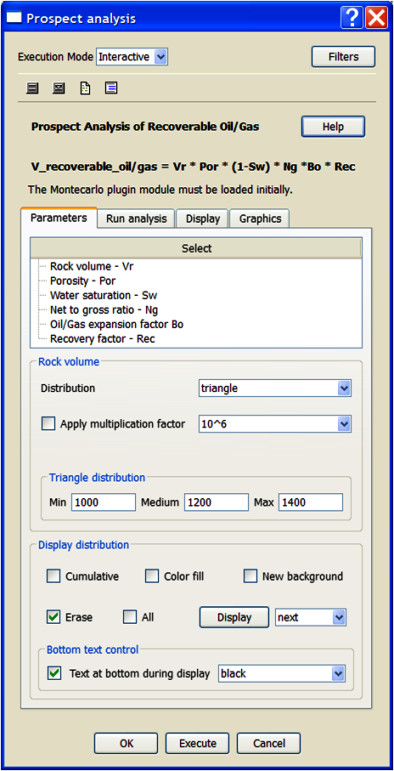
Menu pages for input and prospect analysis
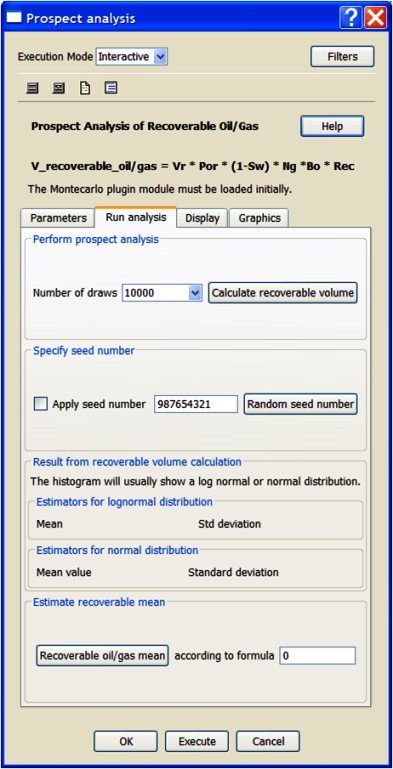
Menu pages for input and prospect analysis
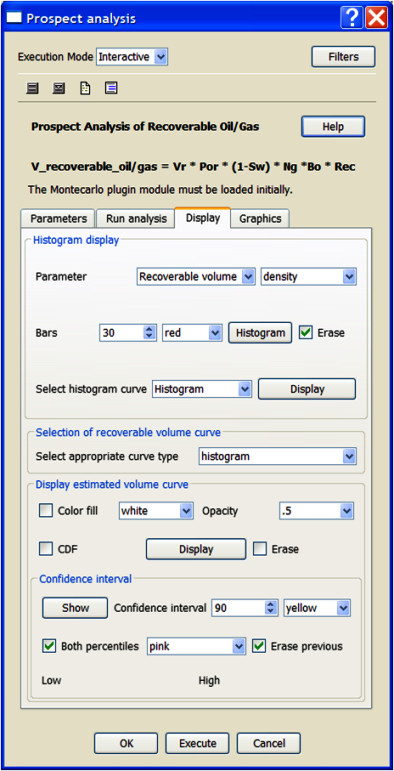
Menu pages for display and graphical presentation
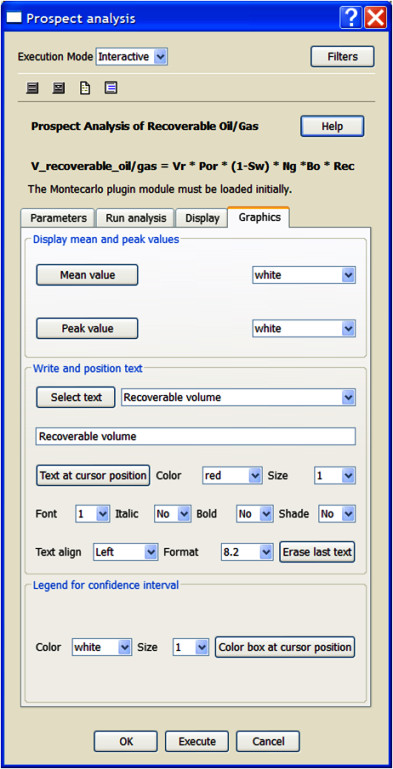
Menu pages for display and graphical presentation
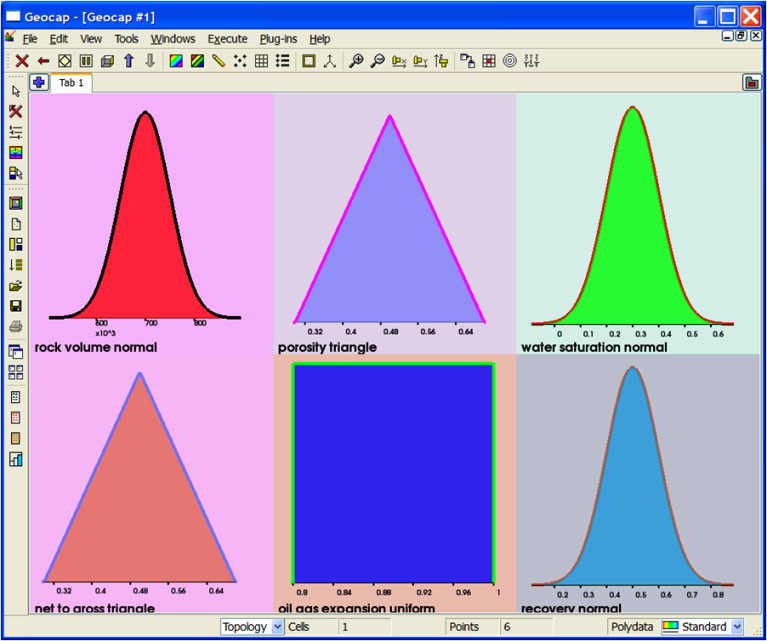
Display of input probability density curves
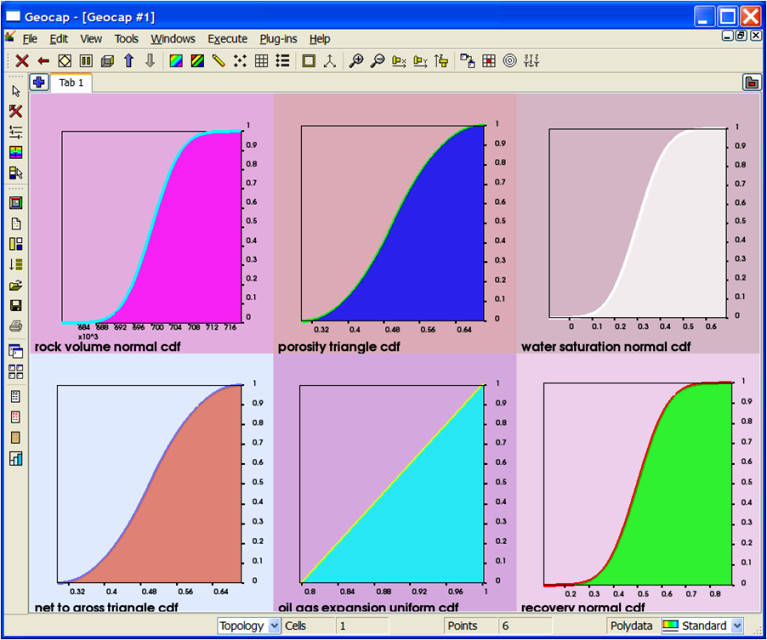
Display of input probability cumulative curves
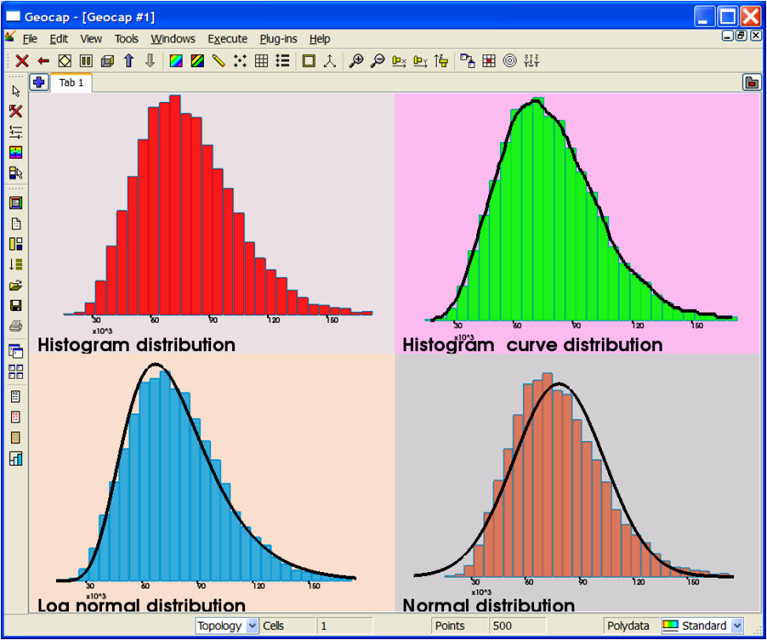
Histogram result of recoverable volume showing a log normal distribution
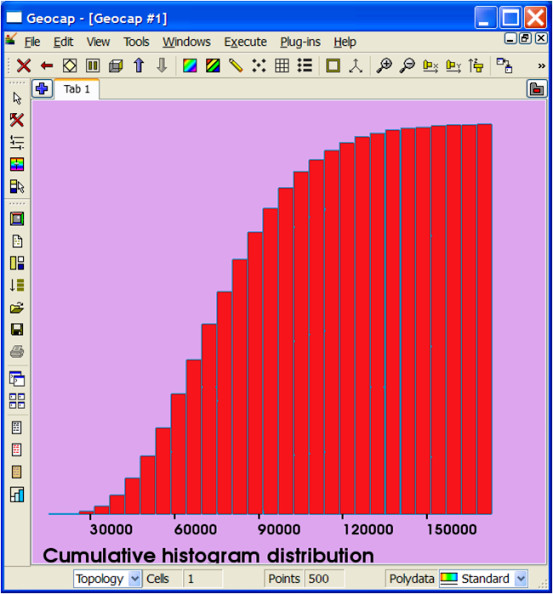
Simulation result displayed in a cumulative histogram distribution
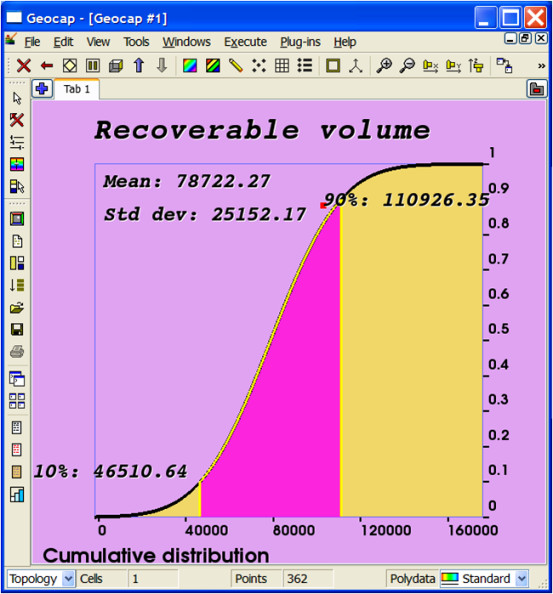
Calculating 10 – 90 confidence interval presented in a cumulative distribution
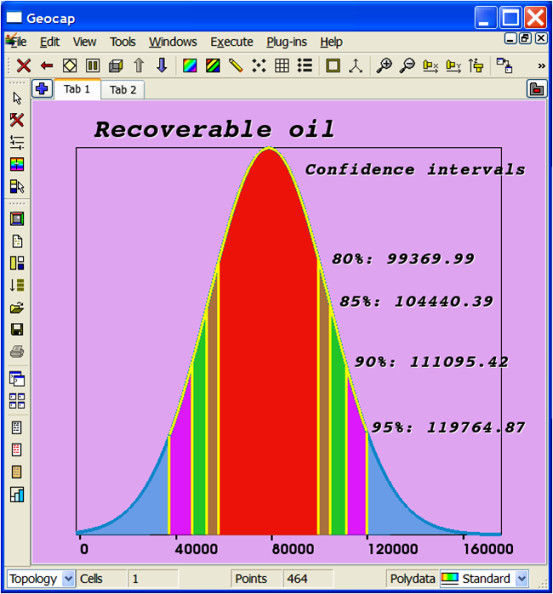
Various confidence intervals for recoverable oil in a normal distribution
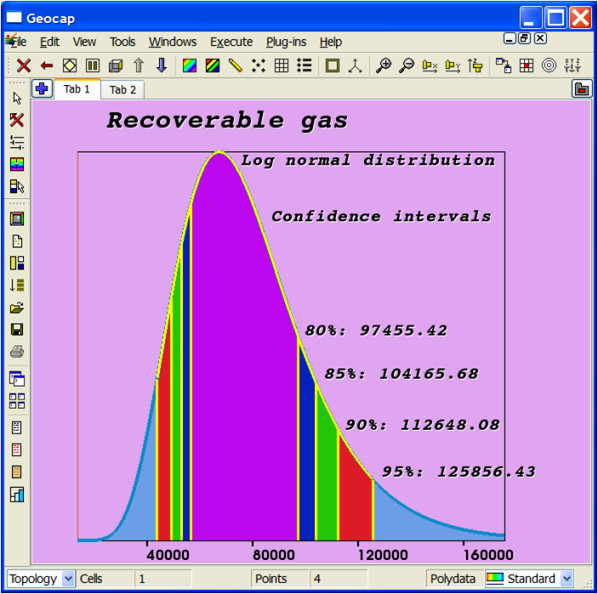
Various confidence intervals for recoverable gas in a log normal distribution
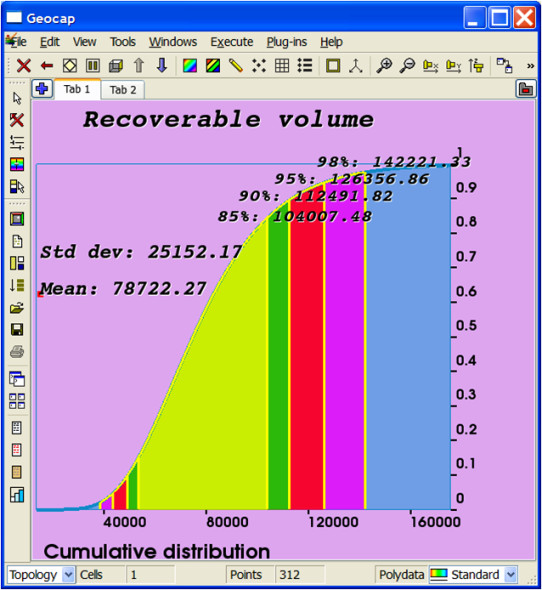
Various confidence intervals for recoverable volume in a log normal cumulative distribution